
 Home
Home Dataset
 Network
 Download
 Tools
Tools Statistics
 Help
HelpCROSSTCR Statistics
Interactive statistics for the TCR Cross-Reactive pMHCs Dataset only. The views summarize group complexity, biological composition, evidence coverage, sequence features, and release sources from the current v1.4.0 primary release.
Analysis scope
Primary table only
All statistics on this page are computed from TCR_CrossReactive_pMHCs.v1.4.0.json. The supplementary pMHC-centered view is intentionally excluded so the analysis reflects the main CROSSTCR resource.
Current data coverage
Primary release snapshot
Counts update with the active filters. The unfiltered view reflects the complete TCR Cross-Reactive pMHCs Dataset.
Group complexity
Cross-reactive group structure
Click a Top group bar to open that group in the Dataset page.
Group-size distribution
Records per cross-reactive group, shown for group sizes 2-9 only.
Top cross-reactive groups
Largest groups under the current filters; bars link to grouped records.
Biological composition
MHC and antigen context
Composition charts support category-level filtering. Click MHC class or peptide origin categories to refine the full dashboard.
MHC class
Normalized MHCI/MHCII composition.
Peptide origin
Curated antigen origin labels, including not-reported entries.
Peptide species
Top source species or pathogen groups represented in the main table.
Clinical context
Clinical-context annotations and reporting completeness.
Evidence and assay coverage
Experimental support and reporting completeness
Evidence and missingness charts identify which records have experimental support, assay annotations, and structure-linked context.
Assay type
Top assay types after filtering.
Structure availability
Structure-linked records versus records without reported PDB structure.
Missingness overview
Percentage of not-reported values in key interpretation fields.
Filtered evidence summary
Compact record-level balance across evidence, structures, and references.
Sequence and pMHC features
Length, similarity, and paired-chain features
Distribution views summarize CDR3 lengths, peptide length, peptide similarity, and paired alpha/beta CDR3 length combinations used for cross-reactivity interpretation.
CDR3 length distribution
Alpha and beta chain CDR3 lengths shown together.
CDR3 length pairing
Joint distribution of paired CDR3 alpha and beta lengths.
Peptide similarity
Binned peptide similarity values from the main table.
Peptide length
Peptide length distribution in amino acids.
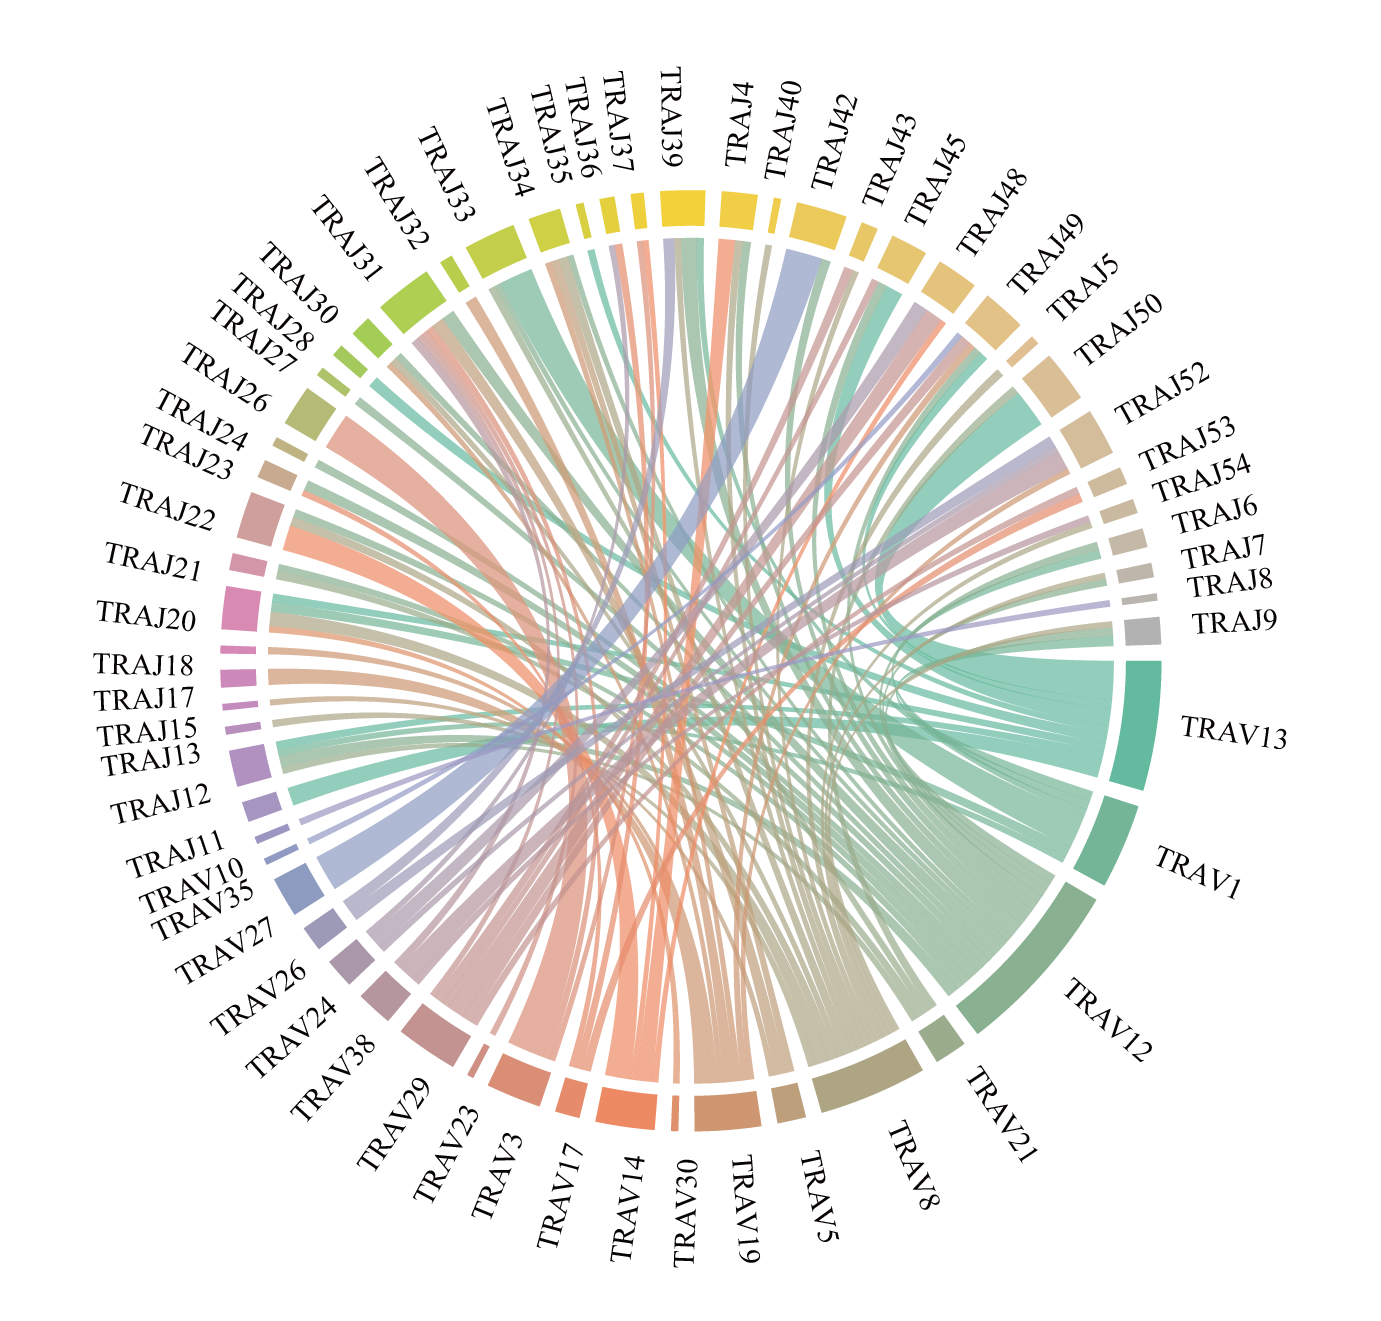
TCR alpha V/J gene usage
Distribution of TRA V and J gene combinations in the primary TCR-centered dataset.
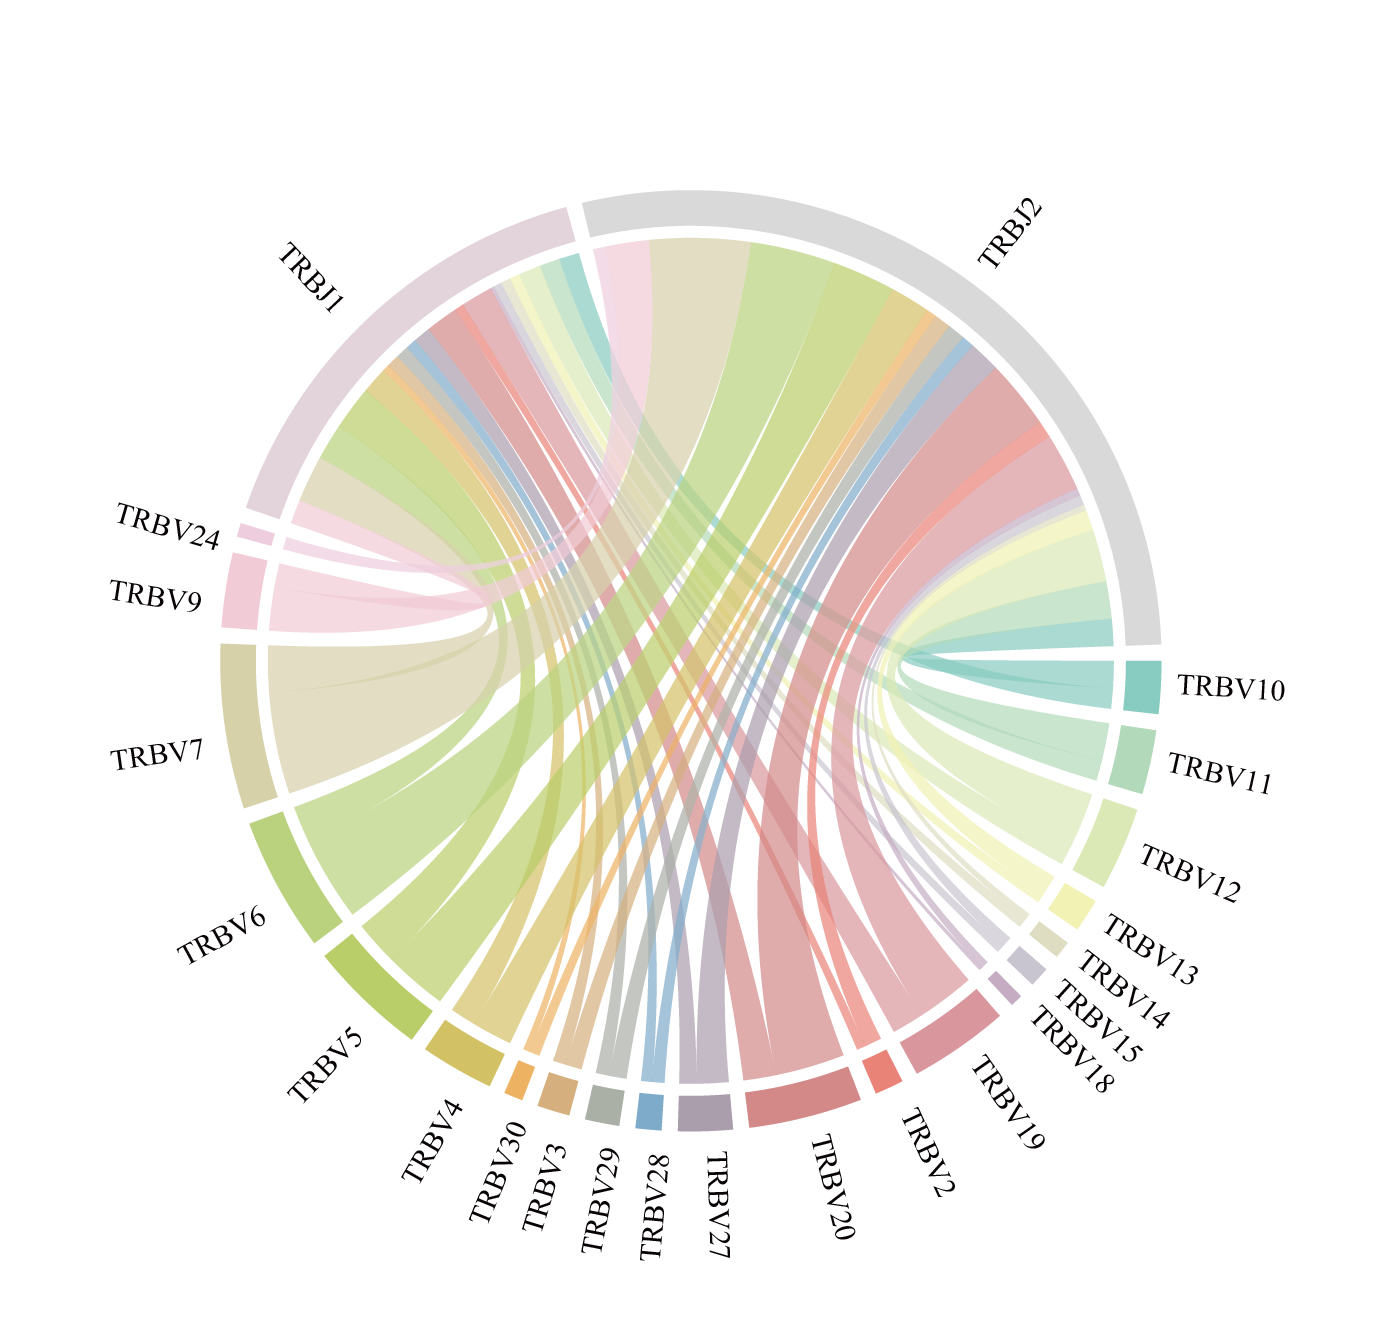
TCR beta V/J gene usage
Distribution of TRB V and J gene combinations in the primary TCR-centered dataset.
Release and source landscape
Time and source coverage
Release-year and reference summaries show how the primary dataset is distributed across publication/source evidence.
Records by release year
Current filtered record count by release year.
Top references
Most frequent source references or domains represented in the selected subset.