This tool can robustly integrate data from diverse sources for disease perturbation scoring and supports feature engineering, outlier identification, clinical data integration, and evaluation of perturbation levels in specific gene sets.
DPS-Tool, as a user-friendly web service, has an intuitive interface and simple operation. Users only need to upload the relevant files and select the required parameters, and they can easily initiate the analysis process and quickly obtain results.
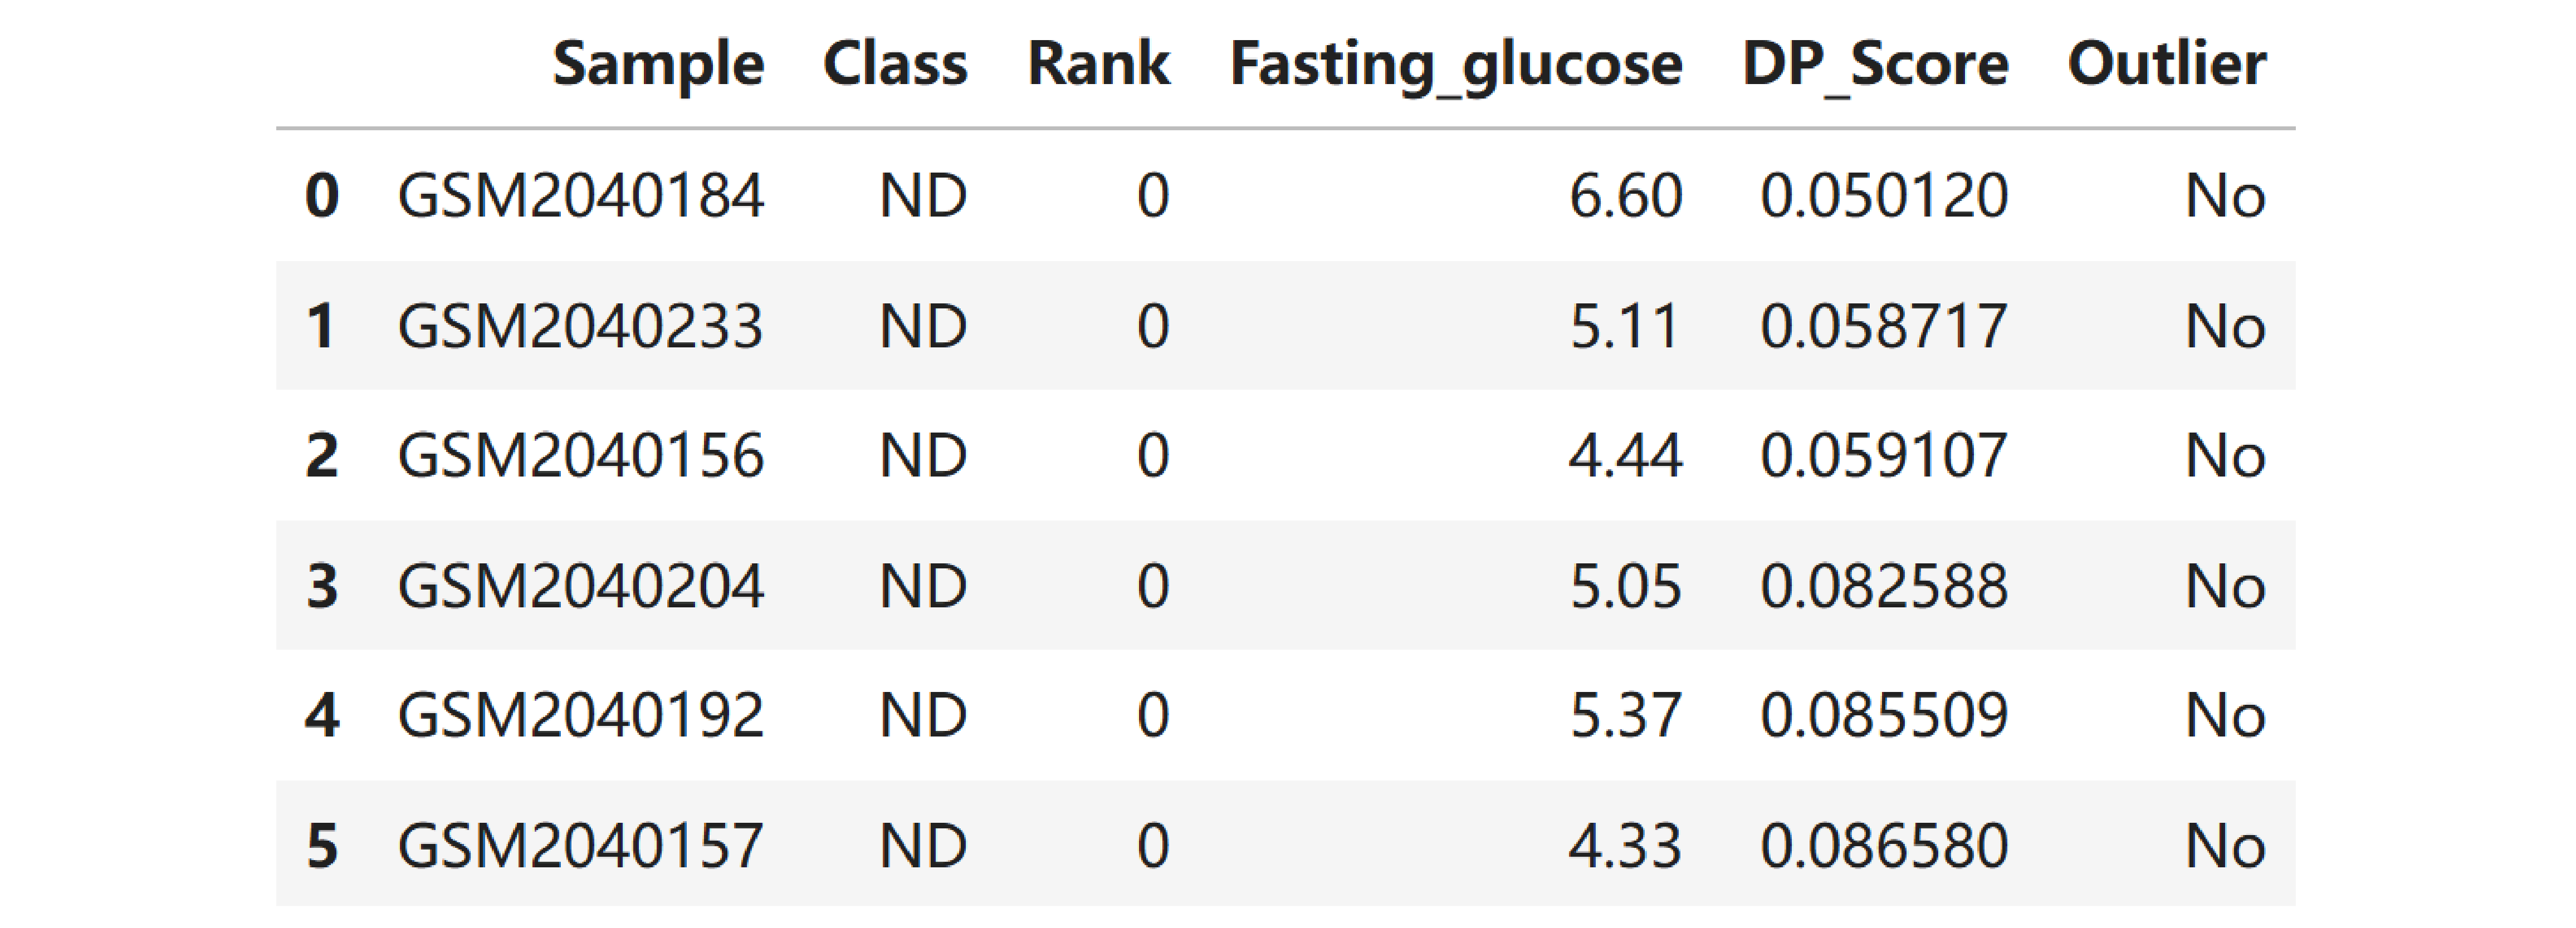
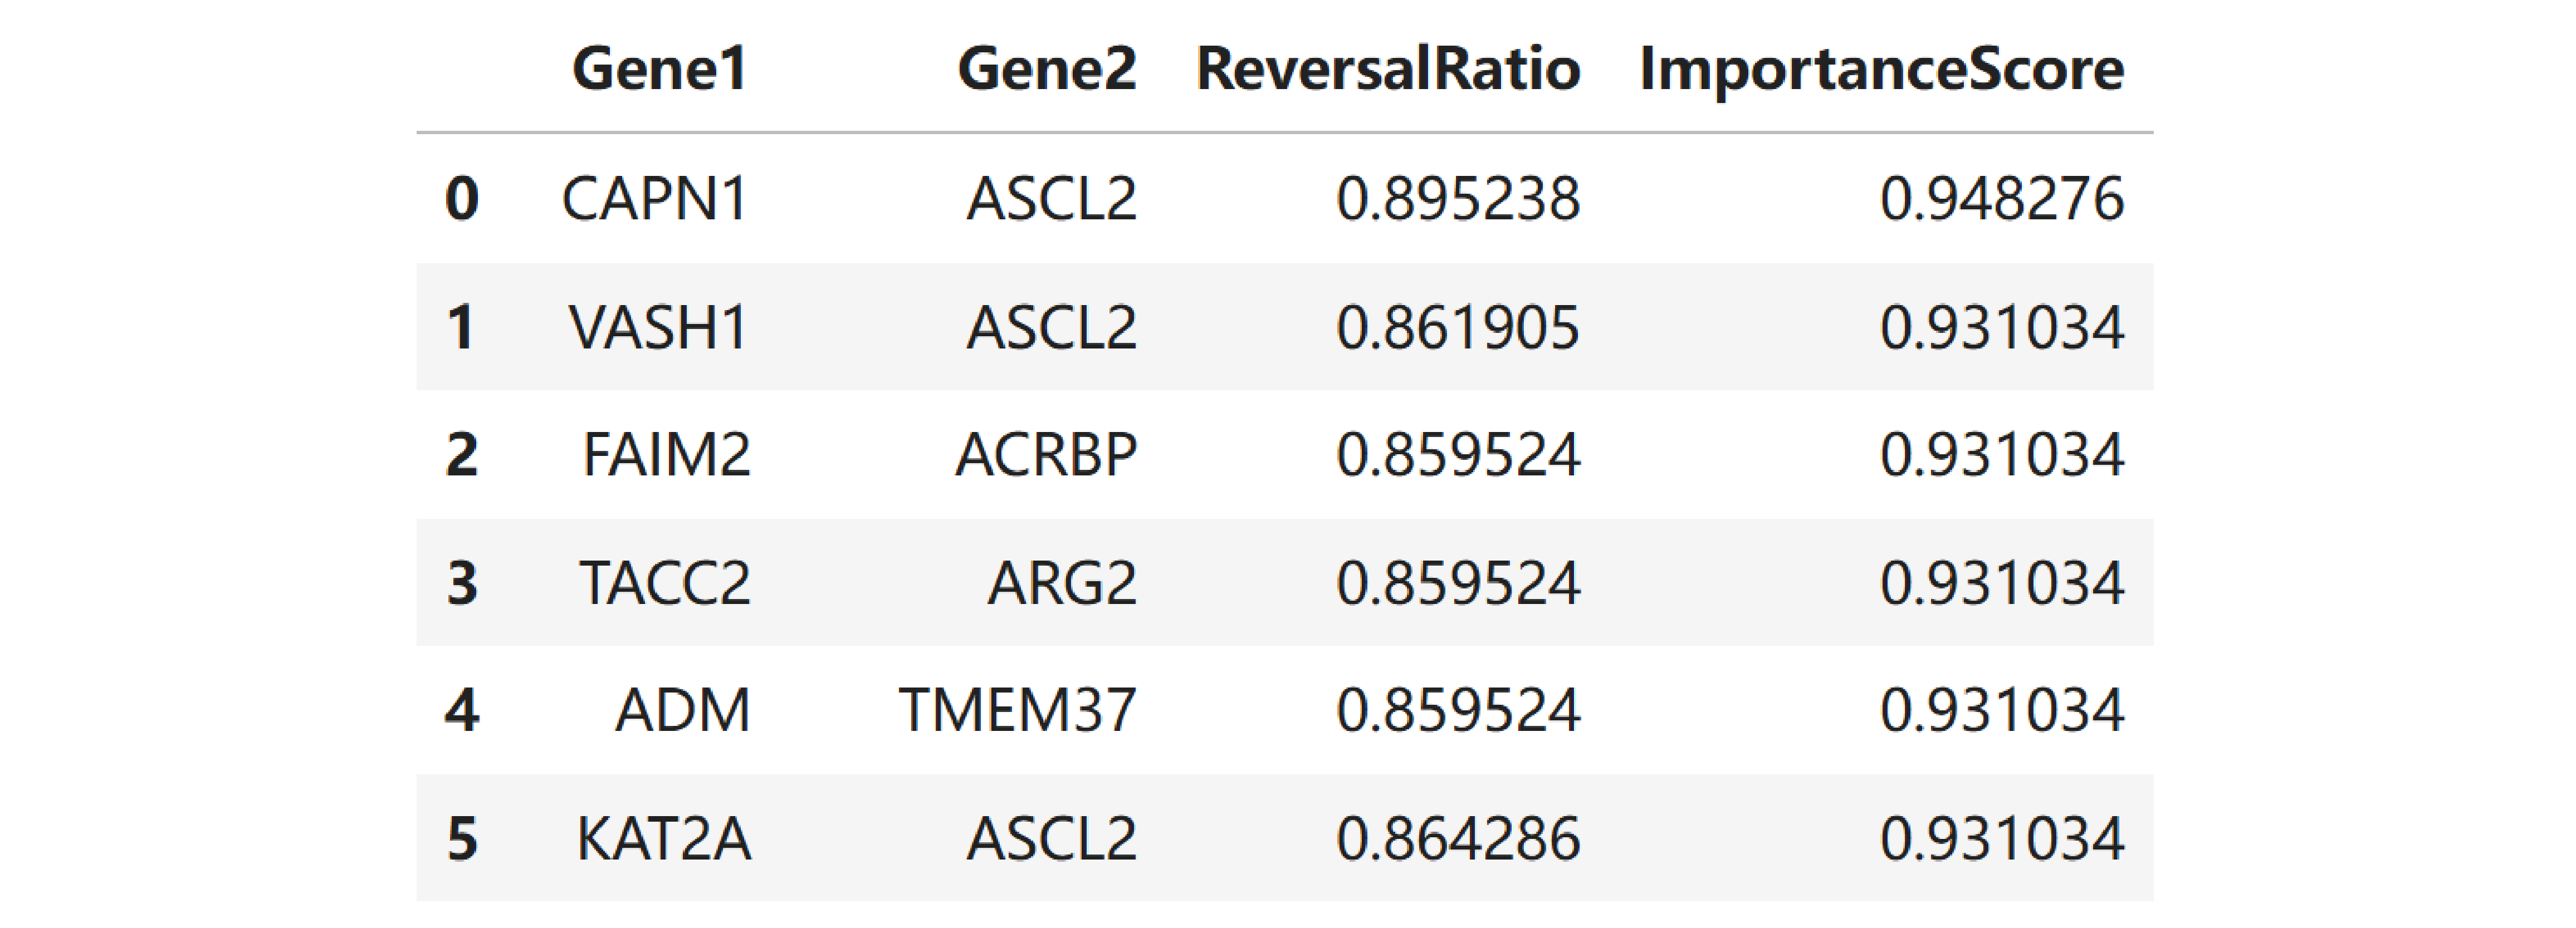
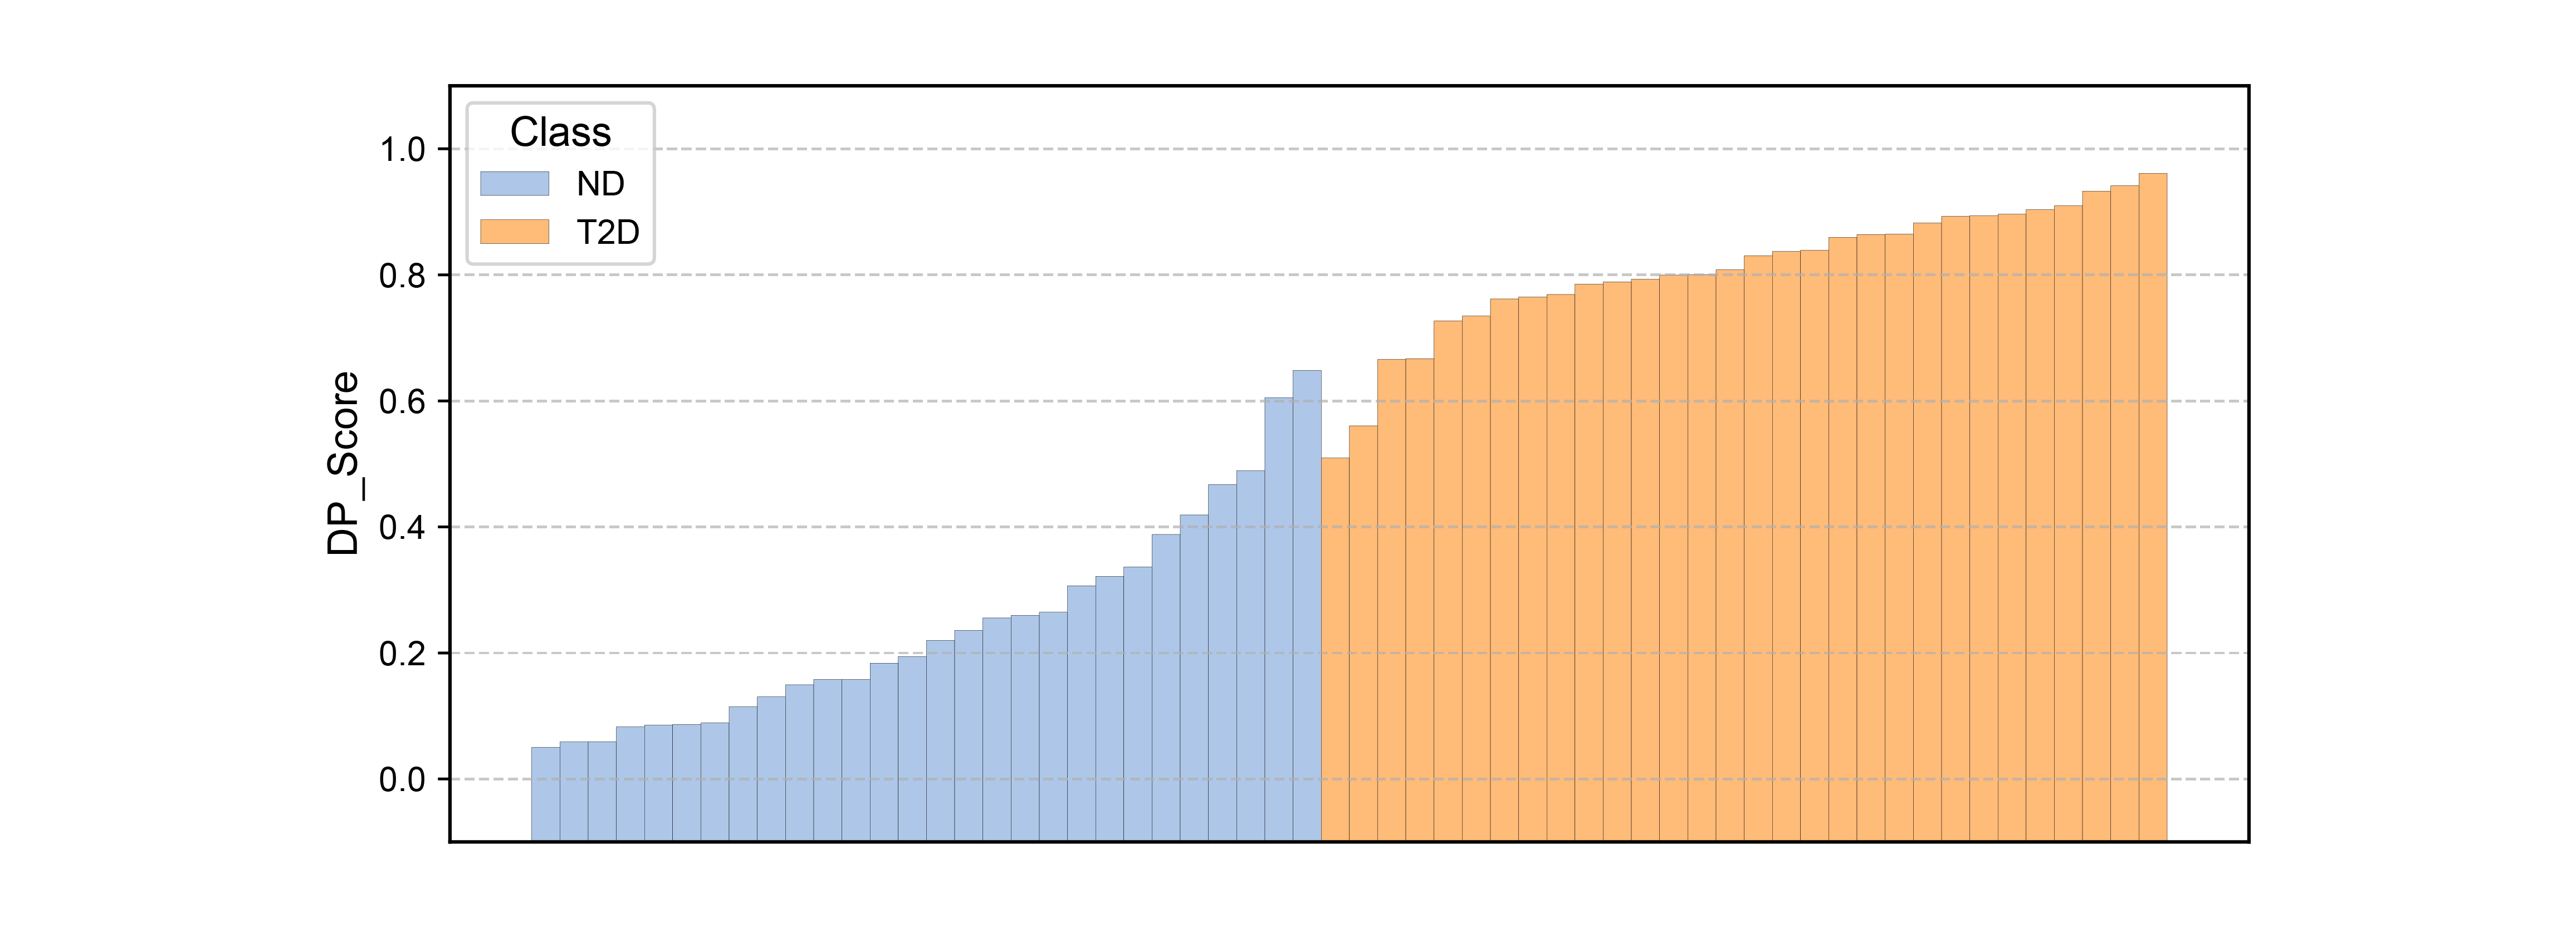
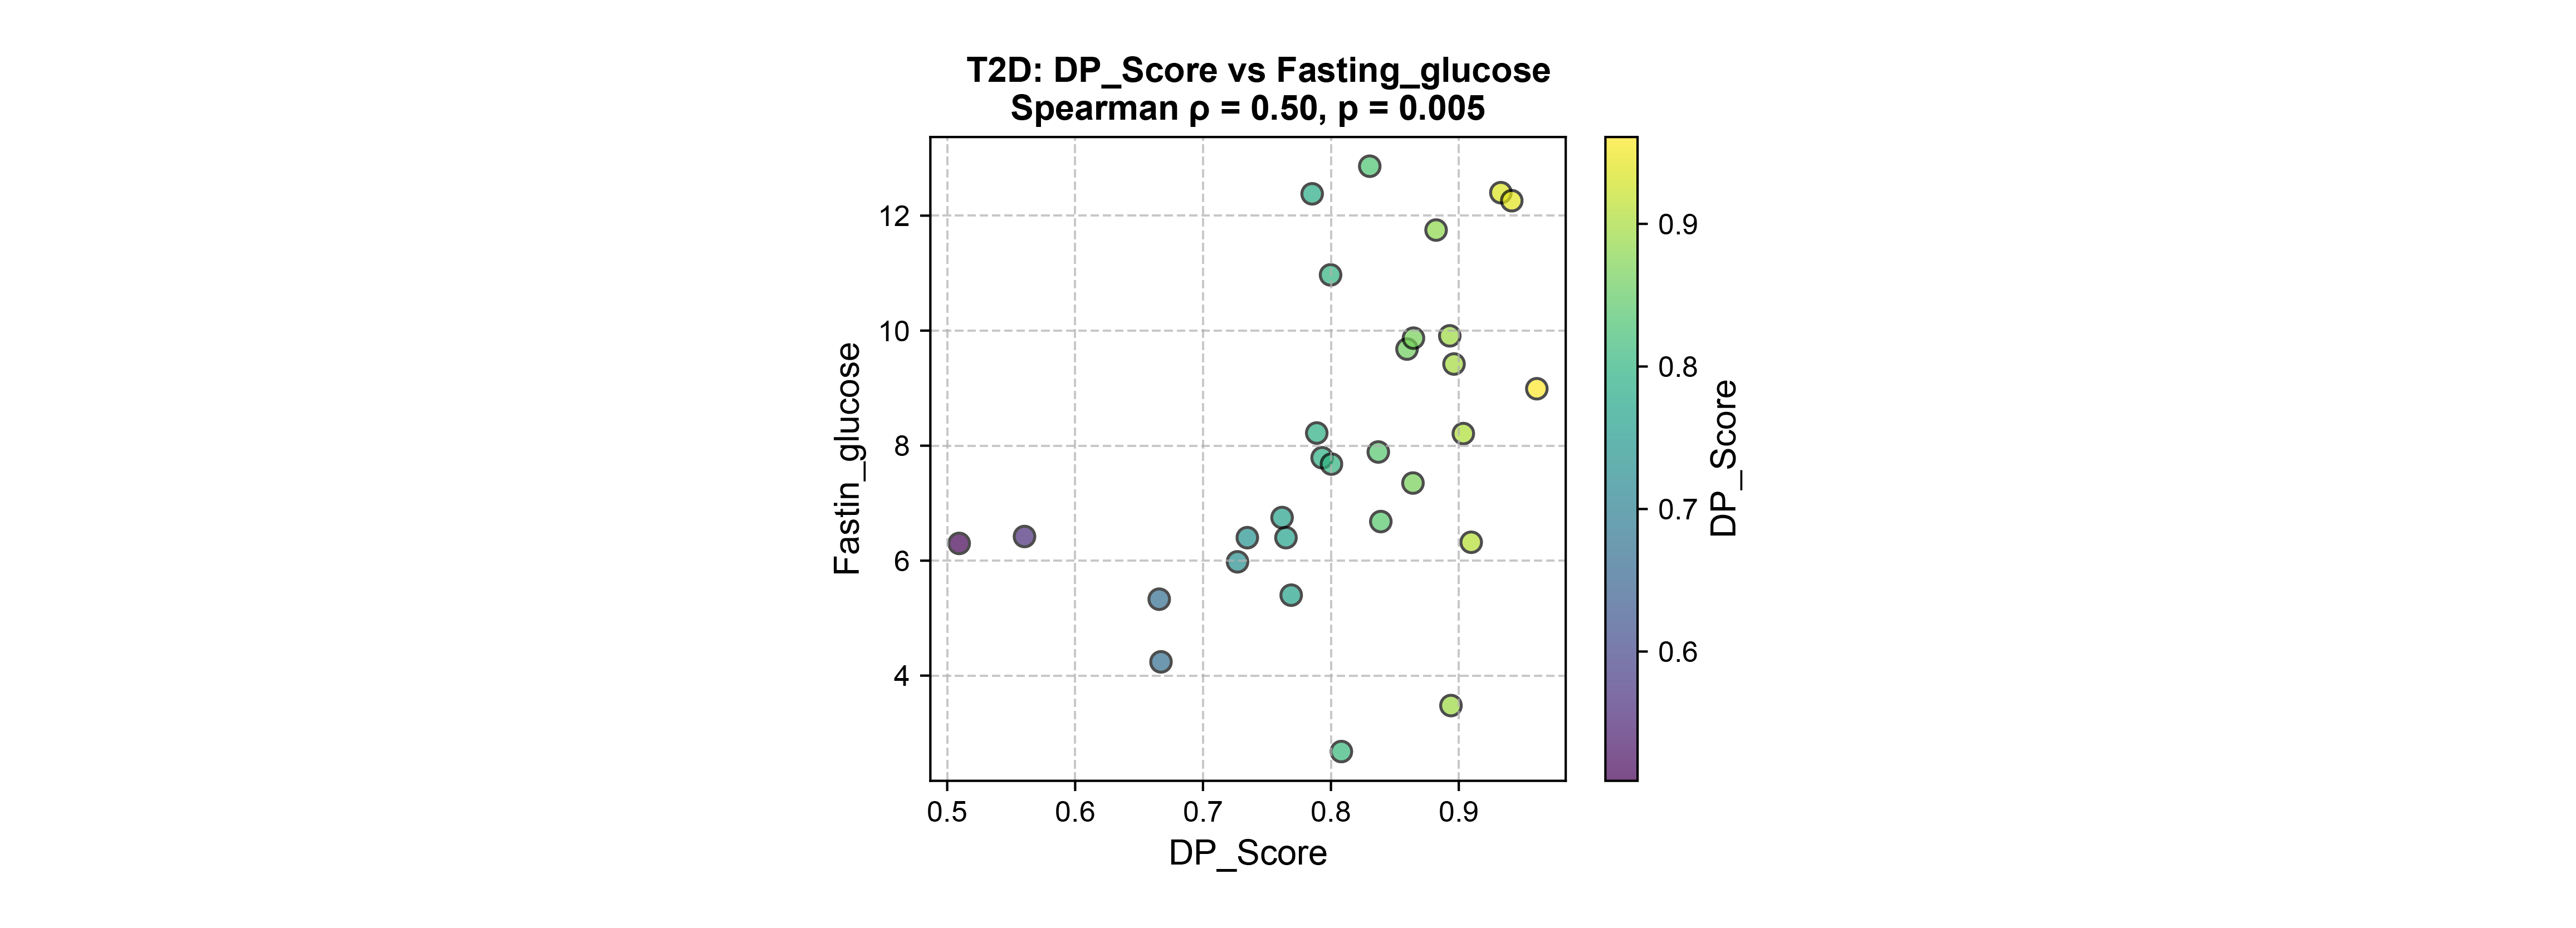
The tool presents analysis results in various forms, including bar charts, box plots, and correlation scatter plots, providing intuitive and easy-to-understand visualizations that help users comprehensively understand data features and underlying patterns.
Paper describing this work has been received in Frontiers of Computer Science (FCS) special column “Code & Data”.
Cited as: Changchun WU, Xueqin XIE, Ziru HUANG, Hao LIN, Jian HUANG. DPS-Tool: An online service platform for disease perturbation scoring. Front. Comput. Sci., 2025, DOI: 10.1007/s11704-025-50841-y