DPS-Tool: Disease Perturbation Scoring Tool
DPS-Tool is a bioinformatics tool designed to quantify the disease perturbation level of samples by analyzing gene expression patterns between positive and negative samples, while providing intuitive visualizations to help researchers understand the perturbation patterns under disease conditions. The tool can be used not only to assess the perturbation levels of the same disease in different states, subtypes, and data sources but also to compare perturbations across different diseases. While obtaining the disease perturbation score, DPS-Tool automatically identifies outlier samples, thereby reducing noise interference in subsequent analyses and enhancing result reliability. Additionally, the key gene pairs identified by the tool serve as robust features for distinguishing between positive and negative samples, further advancing disease diagnosis and classification research. The tool also supports perturbation analysis of disease-related gene sets and studies the correlation between perturbation scores and clinical information. Thanks to its strong robustness against batch effects, DPS-Tool can directly integrate data from different platforms and sources to provide comprehensive and accurate analyses.
Help & Documentation
Getting Started
To get started with DPS-Tool, follow these steps:
- Go to the Run page;
- Upload your expression matrix and sample information files;
- Select the appropriate parameters for your analysis;
- Click "Run Analysis" to start processing;
- Wait for the results to be generated;
- View and download your results.
Input Files
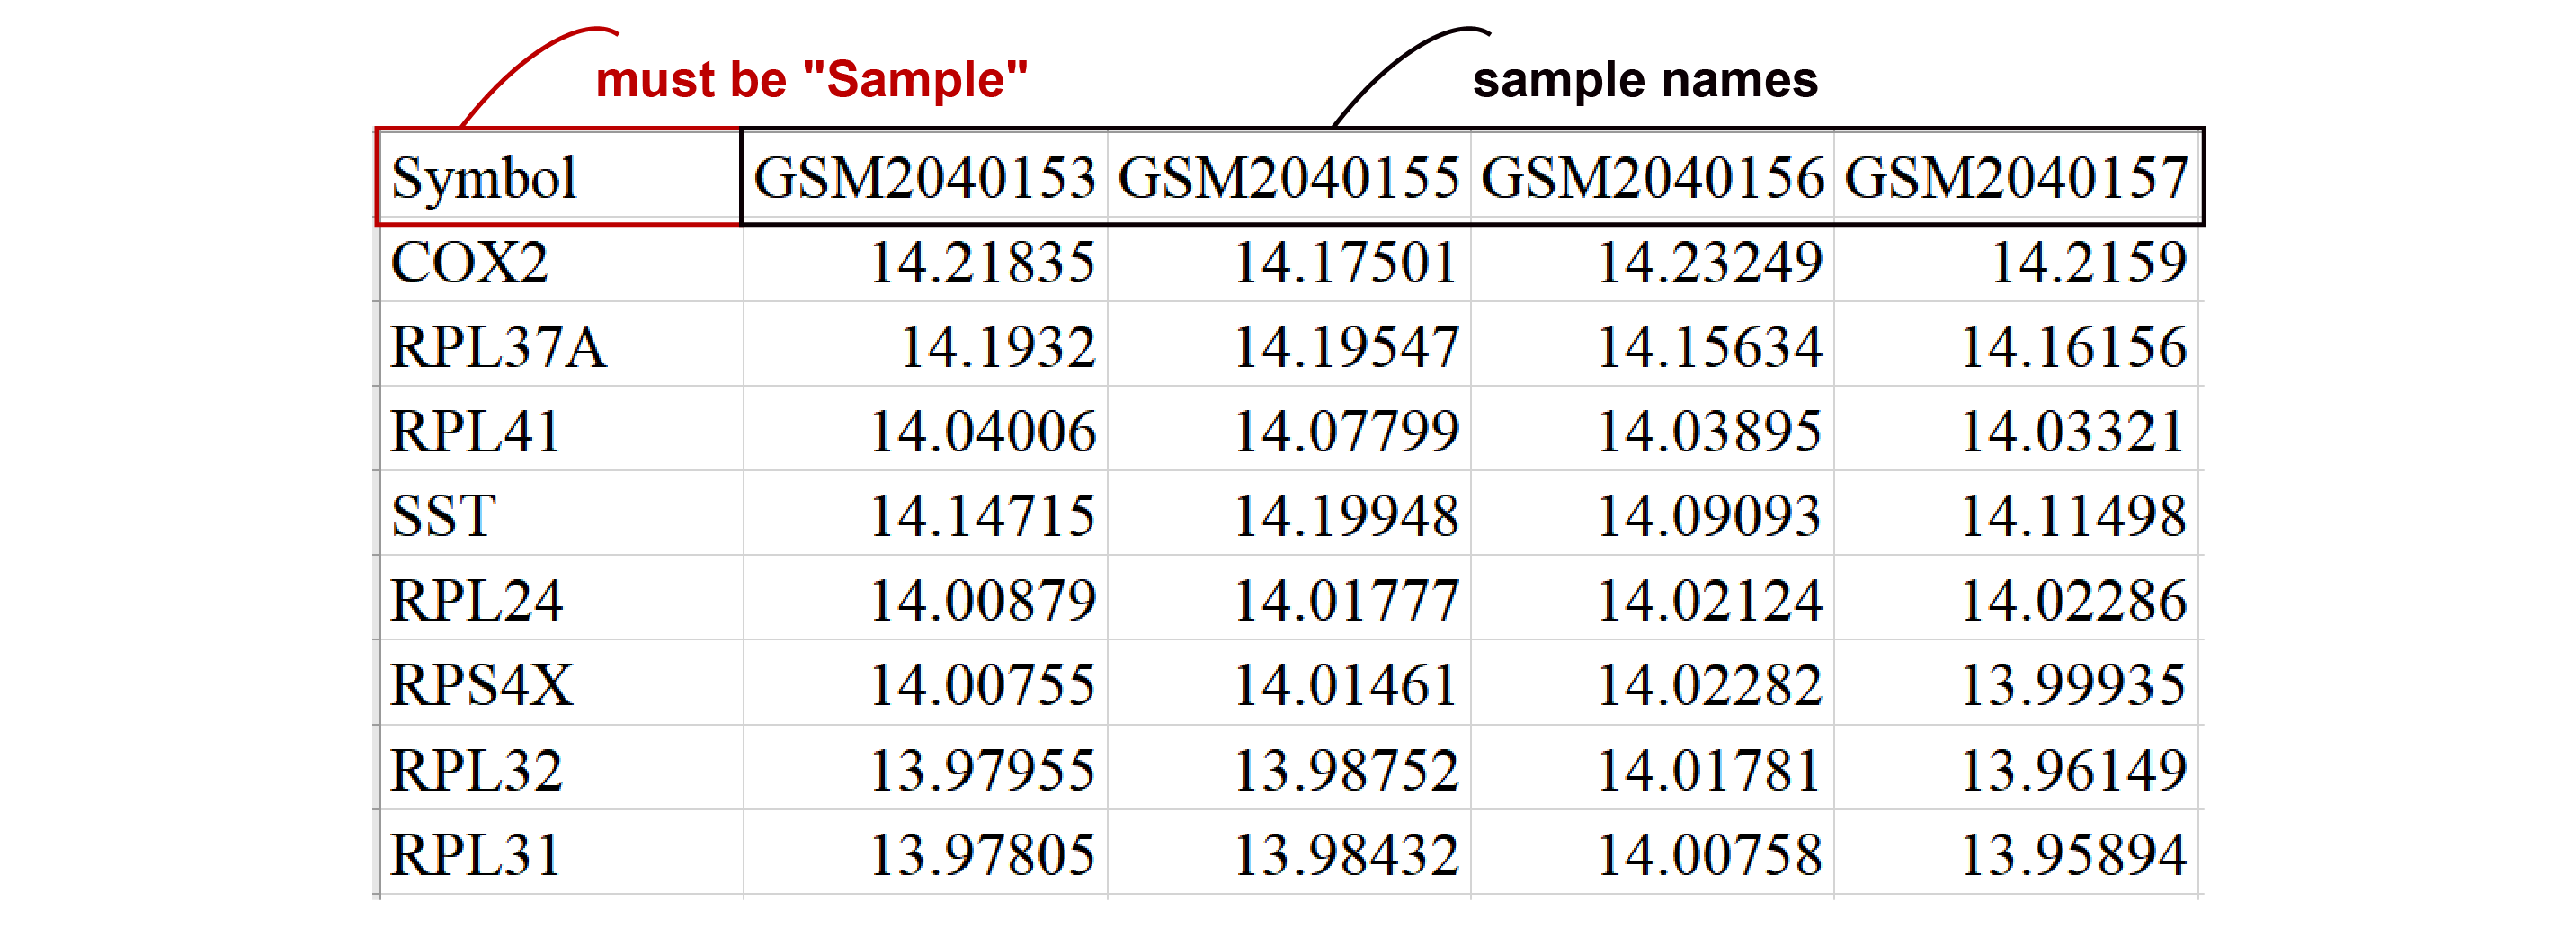
1. Expression Matrix File
- The gene expression matrix must have "Symbol" as the first column for Gene symbols, followed by columns representing expression levels for each sample (with sample names as column headers).
- There should be between 2 and 10 sample categories, with at least 10 negative and 10 positive samples. The matrix must contain more than 100 genes.
- Expression values can be normalized or unnormalized (e.g., Count, TPM, FPKM), and each gene should have a non-zero expression in at least 80% of the samples.
- The file must be in 'CSV' format.
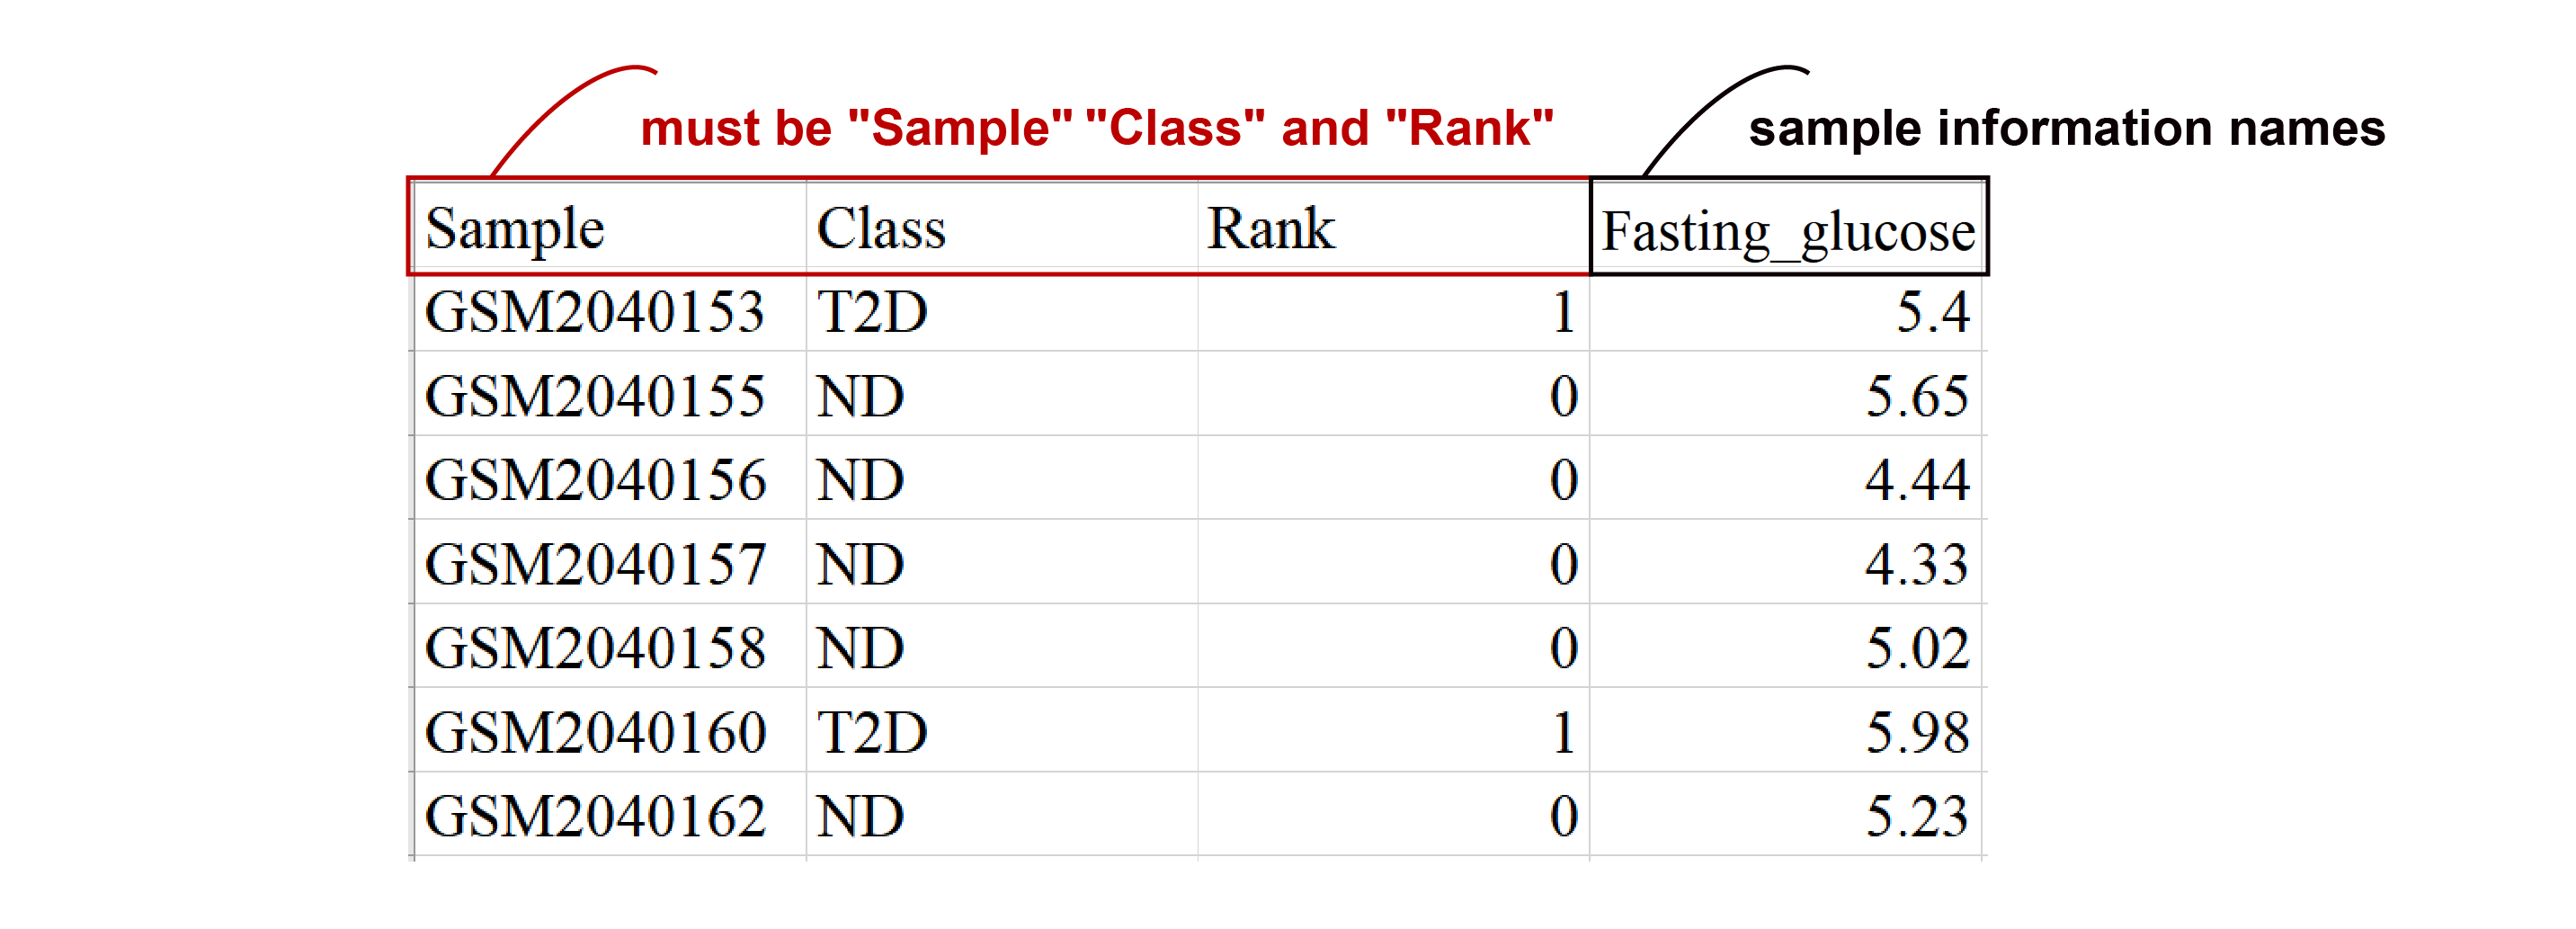
2. Sample Information Matrix File
- The first column should be the sample name (with the column name "Sample"), the second column should be the sample category label (with the column name "Class"), and the third column should represent the rank corresponding to the sample category label, with negative to positive samples labeled as integers starting from 0 (column name: "Rank").
- The "Sample" column in the sample info matrix must match the expression matrix sample names exactly.
- Additional columns like gender and age can be added.
- Column names can only consist of letters, numbers, and underscores.
- Ensure no NA values in the matrix.
- The file must be in 'CSV' format.
Parameters
1. Negative Sample Class
Specify the category of negative samples used for analysis (the leftmost category).
2. Positive Sample Class
Specify the category of positive samples used for analysis (the rightmost category).
3. Reversal Ratio Threshold
The threshold used to extract reversal gene pairs. The value must be between 0.3 and 1, with a default of 0.5. A higher threshold results in fewer gene pairs.
4. Deduplicate Gene Pairs
Some gene pairs satisfying the threshold may contain the same gene. If you choose to deduplicate, only the gene pair with the highest reversal ratio will be retained. The default is not to deduplicate.
5. Gene Set File
Present in a single column, with the column name being the gene set name. The Gene symbol in this column must exist in the "Symbol" column of the expression matrix. The file must be in 'CSV' format.
6. Sample Information Category
Specify the sample information to be used in the analysis. It must be assigned along with Sample Category and Data Type.
7. Sample Category
Specify the sample category to be used in the analysis. It must be assigned along with Sample Information Category and Data Type.
8. Data Type
Specify the data type of the sample information. It must be assigned along with Sample Information Category and Sample Category.
Output
1. Gene Pairs Table
- Gene1: The first gene in a gene pair, which is expressed lower than the second gene in negative samples and higher in positive samples.
- Gene2: The first gene in a gene pair, which is expressed higher than the second gene in negative samples and lower in positive samples.
- ReversalRatio: The reversal ratio of a gene pair between negative and positive samples, defined as the absolute difference in the proportion of Gene1 < Gene2 between the two sample types.
- ImportanceScore: Gene pair importance score, where higher scores indicate a greater difference in the scores of the gene pair between the two sample groups. The maximum value is 1.
The table is sorted in descending order based on the 'ImportanceScore' column.
2. DP_Score Table
Add two new columns to the sample information matrix:
- DP_Score: The disease perturbation score for the corresponding sample, ranging from 0 to 1.
- Outlier: "Yes" indicates an outlier sample.
3. TOP10 Gene Pairs Bar Chart
The Y-axis represents gene pairs, and the X-axis represents their importance scores. Only the Top 10 gene pairs are displayed; if there are fewer than 10, only the available gene pairs will be shown.
4. DP_Score Bar Chart
The Y-axis represents the disease perturbation score, and the X-axis represents samples. Different colors are used to distinguish the sample categories, showcasing the score differences among them.
5. DP_Score Boxplot
The Y-axis represents the disease perturbation score, and the X-axis represents different sample categories, showcasing the differences in scores among them.
6. DP_Score With Sample Information Plot
- When the sample information is 'Discrete', the relationship between the sample information and the disease perturbation score is displayed using box plots.
- When the sample information is 'Continuous', the correlation between the sample information and the disease perturbation score is shown using a scatter plot.
Frequently Asked Questions
Have Questions or Need Support?
If you have any questions about DPS-Tool, need technical support, or want to provide feedback, please feel free to reach out to us using the contact information below.
Contact Information
- Institute: University of Electronic Science and Technology of China
- Address: No.2006, Xiyuan Ave, West Hi-Tech Zone, Chengdu, Sichuan
- Email: hj@uestc.edu.cn
- Website: Dr. Jian Huang's Bioinformatics Lab