Browse
At the front-end, five tables i.e. BiopanningDataSet, Target, Template, Library and Structure can be browsed. Users can browse the five main tables by clicking the corresponding option from the "Browse" drop-down menu in the menu bar. If one selected one of the five tables and pressed it, a paged summary table will appear at first. Each page has 25 entries. Users can move from page to page by selecting or entering the number of page at the bottom of each page. Once users enter into the browse page, browsing the five main tables also can be achieved by selecting the corresponding menu item on the top side of browse interface. Data can be downloaded in xml files via selecting options "Download all data", "Download this page" or "Download selected". If users choose "Download all data", all data in one table will be downloaded. If users select "Download this page" option, data in the corresponding page will be downloaded. If users want to download specified entries, they should check the corresponding entries and choose "Download selected" option.
To have view of the biopanning data, one should select the "Biopanningdataset" table. A paged summary table will appear at first, in which are the fields of BiopanningDataSet ID, Peptide Sequences(Abundance)[Affinity Value] and Reference.
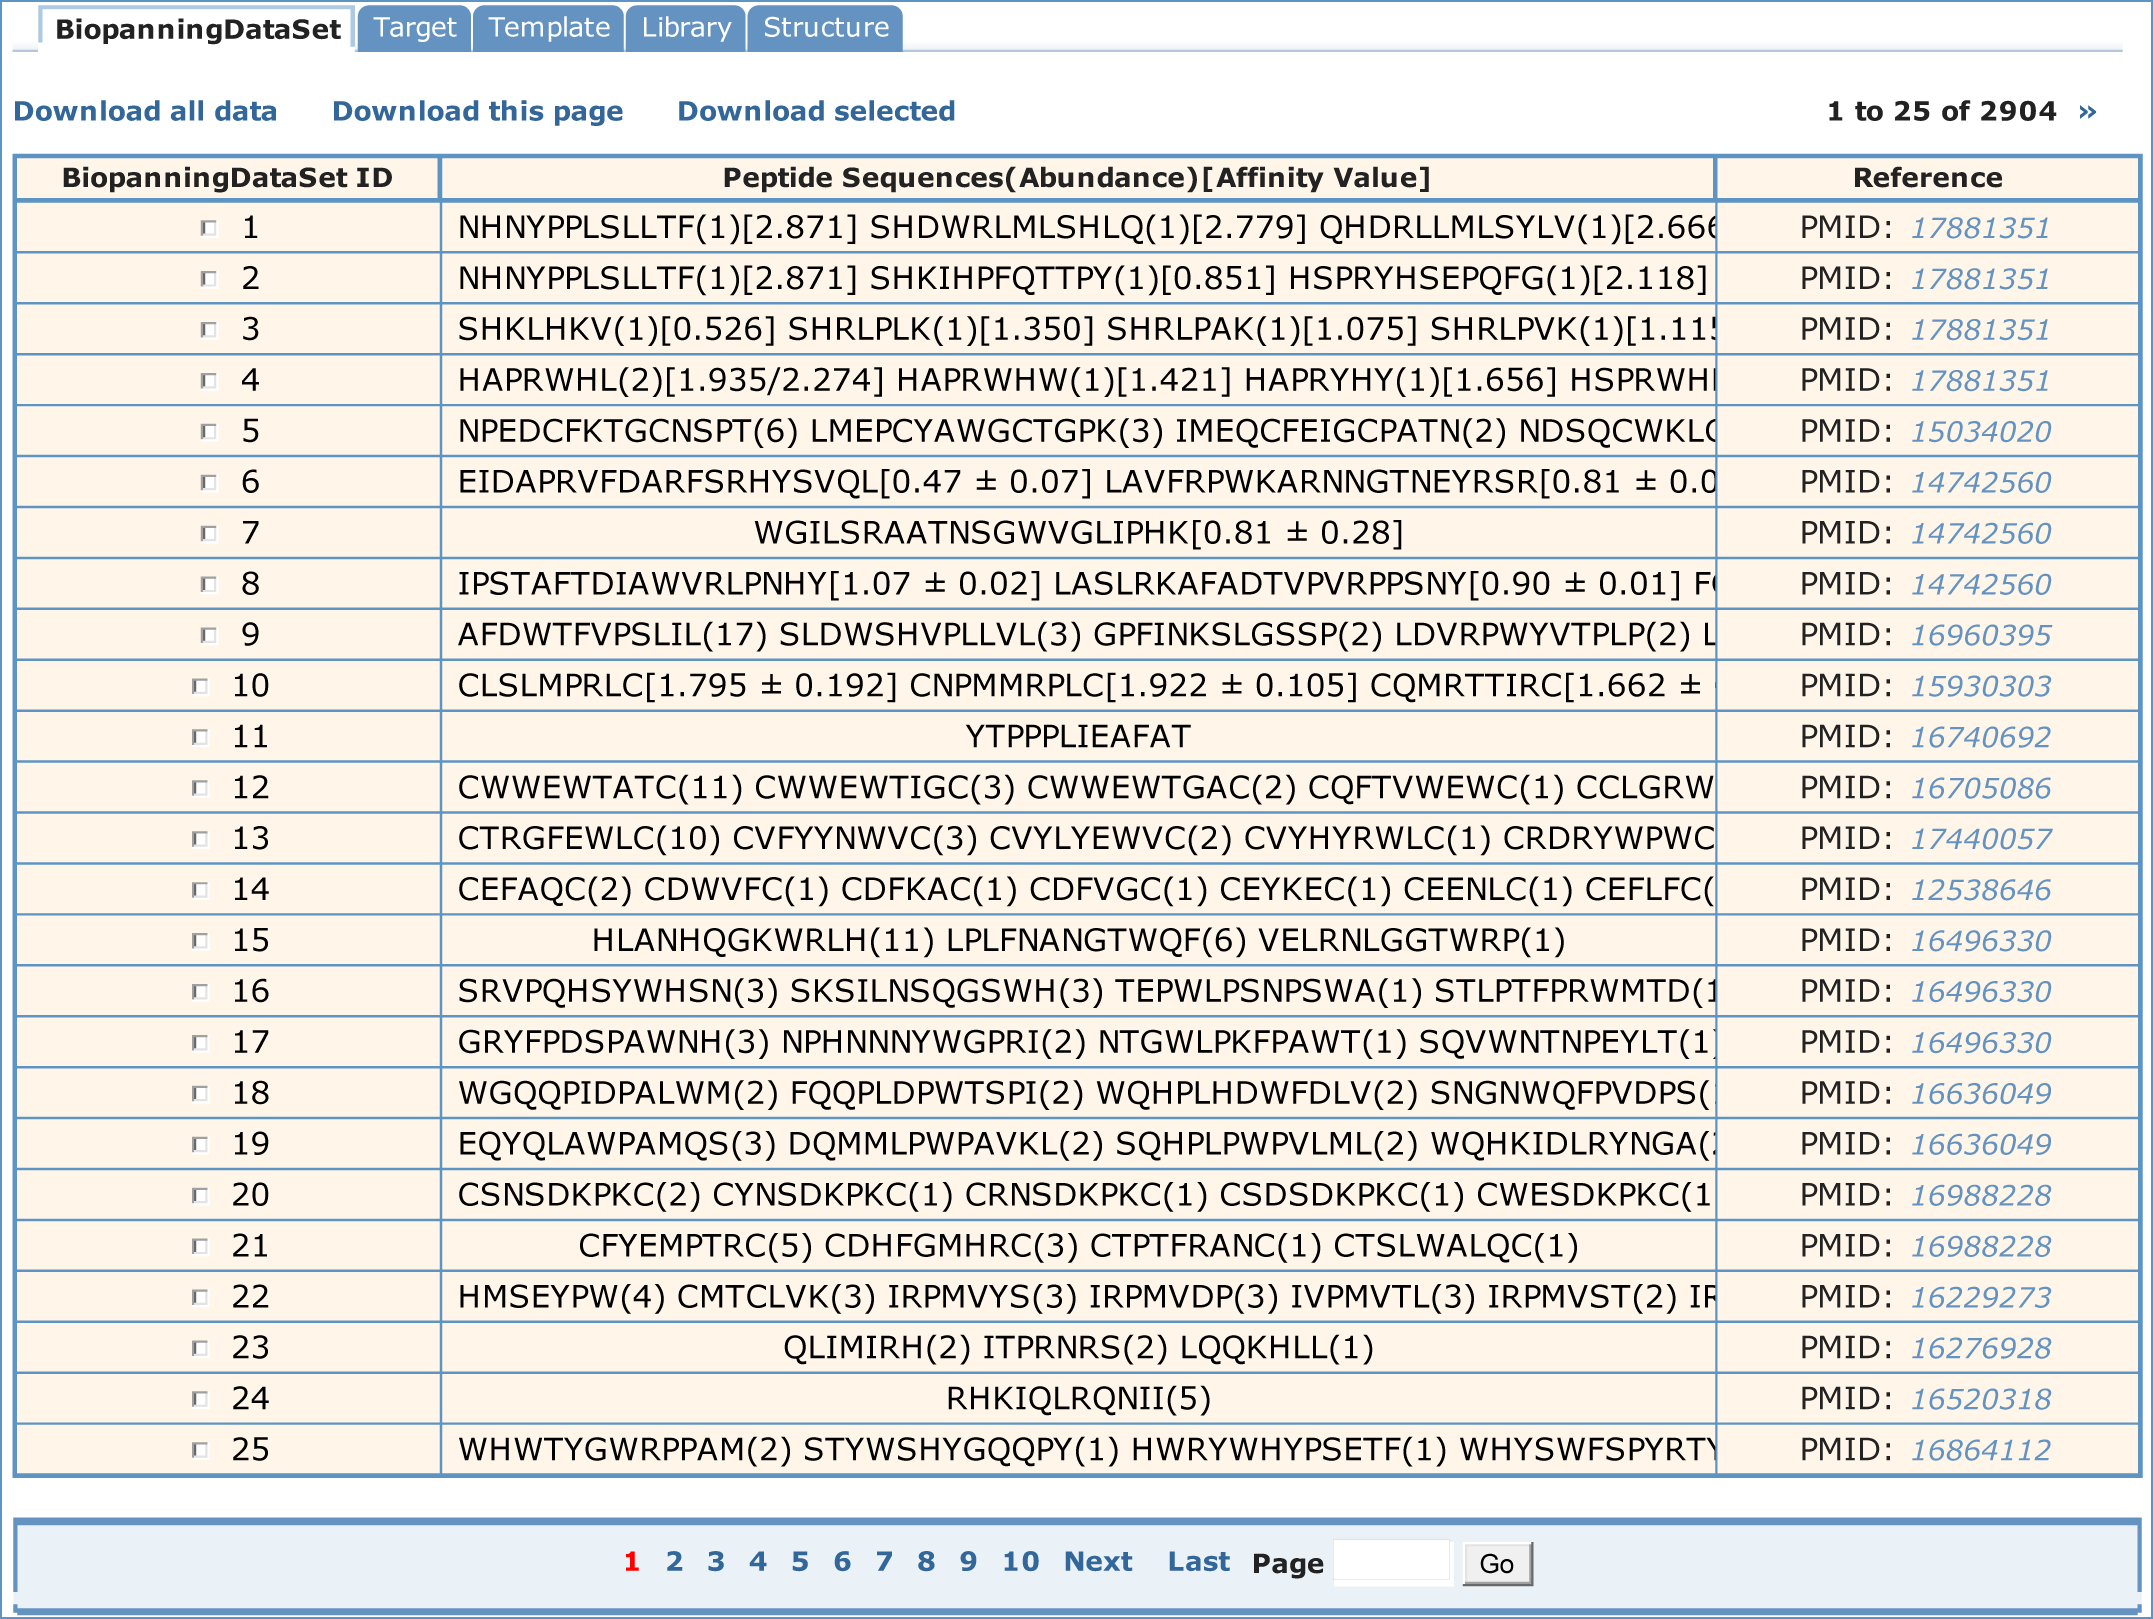
Explanations for fields in simple table
(1) BiopanningDataSet ID
BiopanningDataSet ID represents unique identification of biopanning data set in BDB. It can be hyperlinked to corresponding biopanning data set in table BiopanningDataSet.
(2) Peptide Sequences(Abundance)[Affinity Value]
This field lists part or all of peptides in a set of biopanning data with peptide abundance and affinity value. It can be hyperlinked to corresponding biopanning data set in table BiopanningDataSet. All sequences are recorded in one-letter amino acid codes. Few sequences in BDB have ambiguous residue codes such as B, Z, J and X, where B stands for asparagine or aspartic acid, Z for glutamine or glutamic acid, J for leucine or isoleucine and X for any amino acid. If available, the appearing times (an integer) or frequency (a decimal between zero and one) of selected peptide sequences are given in the brackets right behind each sequence. If available, the affinity values of selected peptide sequences are given in the square brackets right behind each sequence or the parenthesis.
(3) Reference
This field lists PMID if recorded in PubMed, otherwise the DOI name or URL and can be hyperlinked to corresponding manuscript in other public sources.
Fields and descriptions of BiopanningDataSet table
To access the detailed information about a set of biopanning data, you can choose corresponding BiopanningDataSet ID or Peptide Sequences(Abundance)[Affinity Value] in the simple table. Below is the detailed information of the first record in table BiopanningDataSet. Users can move from one entry to entry by clicking "First", "Prev", "Next" or "Last" options or entering the Entry ID at the bottom of each page.
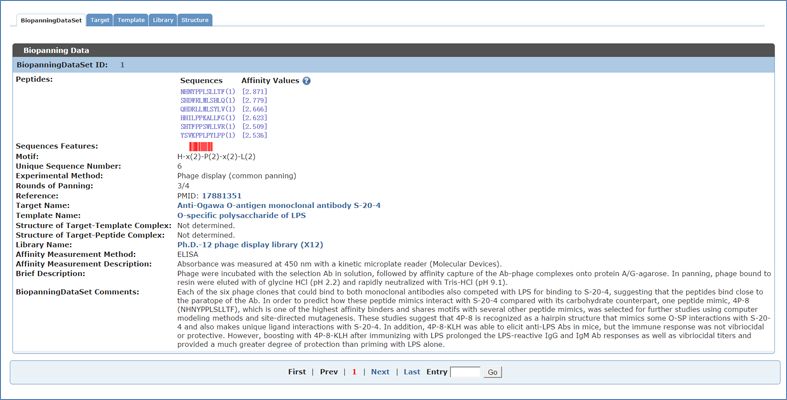
2.1.1 BDB ID (BiopanningDataSet ID)
Unique identification of biopanning data set in BDB.
2.1.2 Peptides (Sequence, Abundance, Affinity value)
A set of biopanning data with peptide abundance and affinity values if available. If available, the appearing times (an integer) or frequency (a decimal between zero and one) of selected peptide sequences are given in the brackets right behind each sequence. If available, the affinity values of selected peptide sequences are given in the square brackets right behind each sequence or the parenthesis.
(1) Sequence
All sequences are recorded in one-letter amino acid codes. Few sequences in BDB have ambiguous residue codes such as B, Z, J and X, where B stands for asparagine or aspartic acid, Z for glutamine or glutamic acid, J for leucine or isoleucine and X for any amino acid. There are some sequences containing parentheses. For example, the peptide, N(N/T)KRCYMDLCIQTP, is translated as NNKRCYMDLCIQTP or NTKRCYMDLCIQTP.
Note:
The following peptides in BDB contain parentheses.
LPG(M/L)KHTPSPTDHLFKSNTLL(H/D)PPCTA(A/P)LWRICCS(G/E)TLWS(K/T)CCGX(F/Y/W)(S/N)HPQC(D/N)TPVCYMNWCVE(S/T)DN(N/T)KRCYMDLCIQTP(E/M)GTICP(M/T)DIKGCN(H/Q)TPTRW(N/D)C(P/R)TTYCPPSG
(2) Peptide Abundance
In each set of biopanning data, the abundance of each peptide is extracted from the manuscript if available. The abundance may be the appearing times (an integer) or frequency (a decimal between zero and one). The abundance values of selected peptide sequences are given in the brackets right behind each sequence.
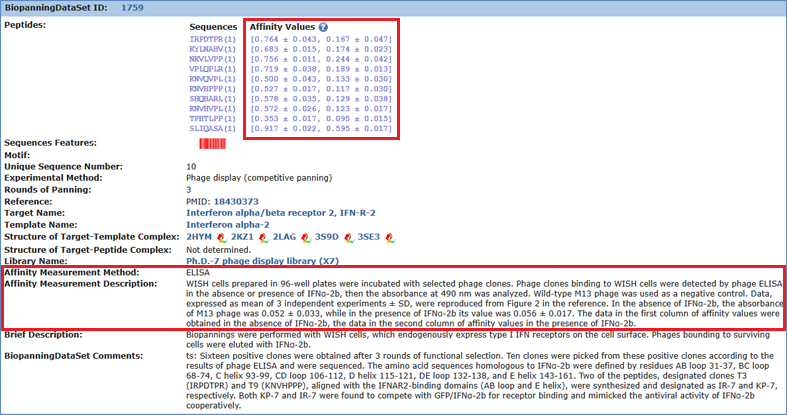
Affinity value is displayed in square brackets after the appearing times or frequency data (if available) of each peptide, which can be categorized into three types: qualitative, semi-quantitative, and quantitative. The qualitative and semi-quantitative data are usually produced by methods such as western blot and dot blot, which are usually illustrated as minus sign or one or more plus sign. The quantitative data are generated by methods such as SPR, ELISA, and QCM, which are often shown as concrete numbers. Affinity data obtained using the same method will be placed in a square bracket. If there are two methods to analyze binding, there will be two square brackets. For each set of biopanning data, relevant affinity measurement method description (if available) will appear when you point your mouse pointer to any affinity data. Snapshot of biopanning data set 1,759 is given as an example.
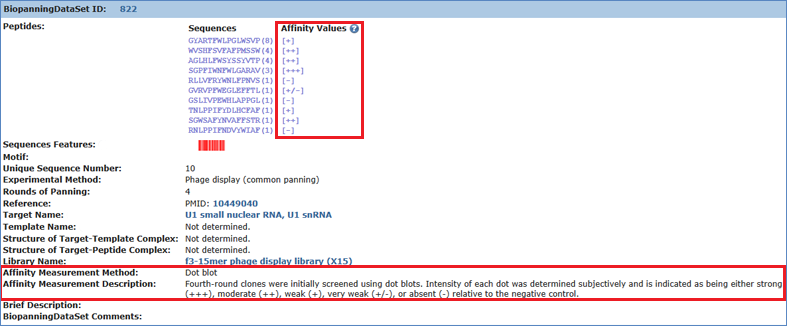
Another example is biopanning data set 822, in which affinity data are semi-quantitative. The data are generated by Dot blot, which are often shown as minus sign or one or more plus sign.
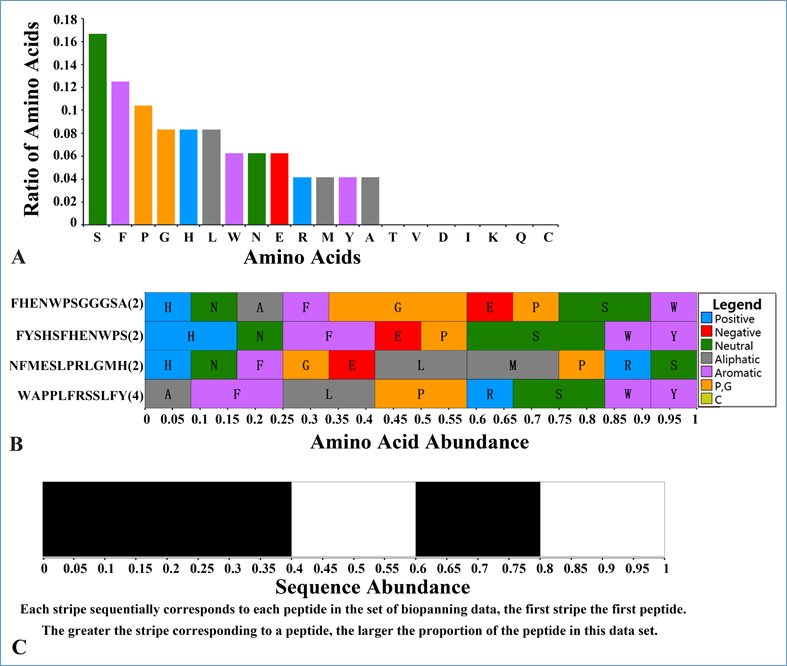
Sequence and amino acid composition biases of each set of biopanning data. For each set of biopanning data, a red barcode ![]() will produce. Clicking it will generate three SVG graphs in a new layer. The first one is the amino acid composition of the whole biopanning data set; the second one is the amino acid composition for each peptide; and the third one is a bar in black and white, representing the abundance of each peptide. For the second graph, the greater the stripe corresponding to each amino acid, the larger the proportion of the amino acid in the peptide. For the third graph, each stripe sequentially corresponds to each peptide in the set of biopanning data, the first stripe the first peptide. And the greater the stripe corresponding to each peptide, the larger the proportion of the peptide in the set of biopanning data. If you open each graph in a new tab, concrete numbers will show where you point your mouse pointer to. In short, this tool is very helpful for visualizing the sequence and amino acid composition biases of each set of biopanning data.
will produce. Clicking it will generate three SVG graphs in a new layer. The first one is the amino acid composition of the whole biopanning data set; the second one is the amino acid composition for each peptide; and the third one is a bar in black and white, representing the abundance of each peptide. For the second graph, the greater the stripe corresponding to each amino acid, the larger the proportion of the amino acid in the peptide. For the third graph, each stripe sequentially corresponds to each peptide in the set of biopanning data, the first stripe the first peptide. And the greater the stripe corresponding to each peptide, the larger the proportion of the peptide in the set of biopanning data. If you open each graph in a new tab, concrete numbers will show where you point your mouse pointer to. In short, this tool is very helpful for visualizing the sequence and amino acid composition biases of each set of biopanning data.
Pattern or consensus sequence extracted from the article if available. All patterns or consensus sequences are shown in PROSITE format. For some sets of biopanning data, there is more than one motif. In this condition, peptides in one set of biopanning data are grouped into several classes. Thus, several patterns or consensus sequences are obtained from those classes.
2.1.5 UniSeqNO (Unique Sequence Number)
The number of different peptides in the current biopanning data set.
Common panning: eluting with acid buffer. Subtractive panning: with additional negative selection steps to remove non-specific binder. Competitive panning: eluting with template or target. In vivo panning: injecting peptide library into the model organism.
Incubate-wash-elute-amplify-Incubate, this is one round of panning. For example, 2-3 means that selected peptides after the second and third round of panning were sequenced. And 3/4 represents that selected peptides after the third or fourth round of panning were sequenced.
PMID if recorded in PubMed, otherwise the DOI name or URL. It can be hyperlinked to corresponding manuscript in other public sources.
The name of the target used to screen the random peptide library. Linked to corresponding record in target table.
The name of the template, which is the genuine partner mimicked by mimotopes and binds to the target. Linked to corresponding record in template table.
2.1.11 SOTTC (Structure of Target-Template Complex)
The PDB code of target-template complex if available. Hyperlinked to the PDB database.
How to view target-template complex?
The interaction sites between the target and template or between target and peptide can be viewed interactively in the context of corresponding 3D structure. The view interface is created by JSmol and PHP codes. When browsing the BDB database, biopanning data set entry with solved structures of target-template or target-peptide complex will have a conspicuous view icon beside its PDB code. Clicking the view icon will initialize the loading of the Jsmol application.
Launch the view interface
Click the view icon beside the PDB code in the Structure table or BiopanningDataSet table. By default, the complex structure is displayed as backbone colored by secondary structure.
Turn segment on and off
Residues composing the interaction site are usually grouped into the same segment if they are spaced by only one residue in the sequence. Each separate segment has a corresponding checkbox. If checked, the corresponding segment will "blink" and then shown in spacefill mode with CPK coloring. To turn segment off, uncheck its box.
Turn chain on and off
If checked, the chain where the interaction site locates will "build" up, from backbone to spacefill. Unchecked, the chain will solve off, from spacefill to backbone.
Zoom in and zoom out
Put your mouse on the structure. Click the left mouse key to get focus and then roll the middle wheel of your mouse down and up. If your mouse has no wheel, you can press SHIFT on the keyboard and drag down and up to zoom in and out.
Spin and rotate
Put your mouse on the structure. Press down the left mouse key and then move your mouse around.
Move structure
Put your mouse on the structure. Press SHIFT and double click left mouse key and then drag.
Reset structure
Click the command button "Reset to Original Size and Position". Or put your mouse on the structure, click the left mouse key to get focus and then press down SHIFT and double click left mouse key.
Show information on atom, residue, and chain
When the site and chain are checked on, they are displayed in spacefill mode. Under this condition, put your mouse to the atom you are interested in and hover for while. Then the information such as the name and the numbering of this atom, the residue and its numbering that the atom belongs to, the chain and its numbering that the residue belongs to will appear on the pointer.
Measure distance, angle and dihedral angle
Under spacefill mode, you can measure the distance between 2 atoms, the angle among 3 atoms, dihedral angle among 4 atoms. Double click on the starting atom, and then move your pointer to the second atom. The distance between the 2 atoms will be displayed in magenta. Move pointer out the image will cancel the measurement. Double click on the second atom will label the distance measured. To delete the label, just do the same measurement again! To measure angle: in brief, double click on the starting atom and then click on the second atom; at last, point to the third atom to show or double click to label the angle. To measure dihedral (torsion) angle: briefly, double click on the starting atom and then click on the second and the third atom; at last, point to the fourth atom to show or double click to label the dihedral.
More complicate operation
Please use the Jmol menu. Put your mouse on the structure image; click the right mouse key will open the Jmol menu. Put the mouse on the Jmol logo at right bottom and click the left mouse key will also open the Jmol menu.
2.1.12 SOTPC (Structure of Target-Peptide Complex)
The PDB code of target-peptide complex if available. Hyperlinked to the PDB database. Click the view icon beside the PDB code will launch the viewer. Viewing target-peptide complex is just as same as viewing target-template complex.
The name of the library used. Linked to record in library table.
2.1.14 AMM (Affinity Measurement Method)
ELISA, Western blot, Dot blot, Surface plasmon resonance (SPR), Flow Cytometry, Binding assay, Saturation equilibrium assay, Radioimmunoassay, Optical sensor, Flow cytometry, Fluorescence, Competition experiment, Quartz crystal microbalance (QCM), Resonant mirror biosensor, Fluorescence anisotropy, NMR spectroscopy, Fluorescence titration, Fluorescence polarization, Inhibition assay, Micropanning assay, Isothermal titration calorimetry (ITC), Densitometry
2.1.15 AMD (Affinity Measurement Description)
A brief description to special features in an affinity measurement experiment, if necessary.
A brief description to special features in an experiment, if necessary.
2.1.17 BDB Comments (BiopanningDataSet Comments)
Anything. Features of selected peptides are often described here.
If one wished to see the target information, you would select the "Target" table. A paged summary table will be shown, in which are the fields of Target ID, Target Name, Target Source and Corresponding Entries. The Corresponding Entries field summarizes how many sets of biopanning data which include this target and can be hyperlinked to those biopanning data sets. In addition, users can order all the targets by Target ID, Target Name and Target Source.
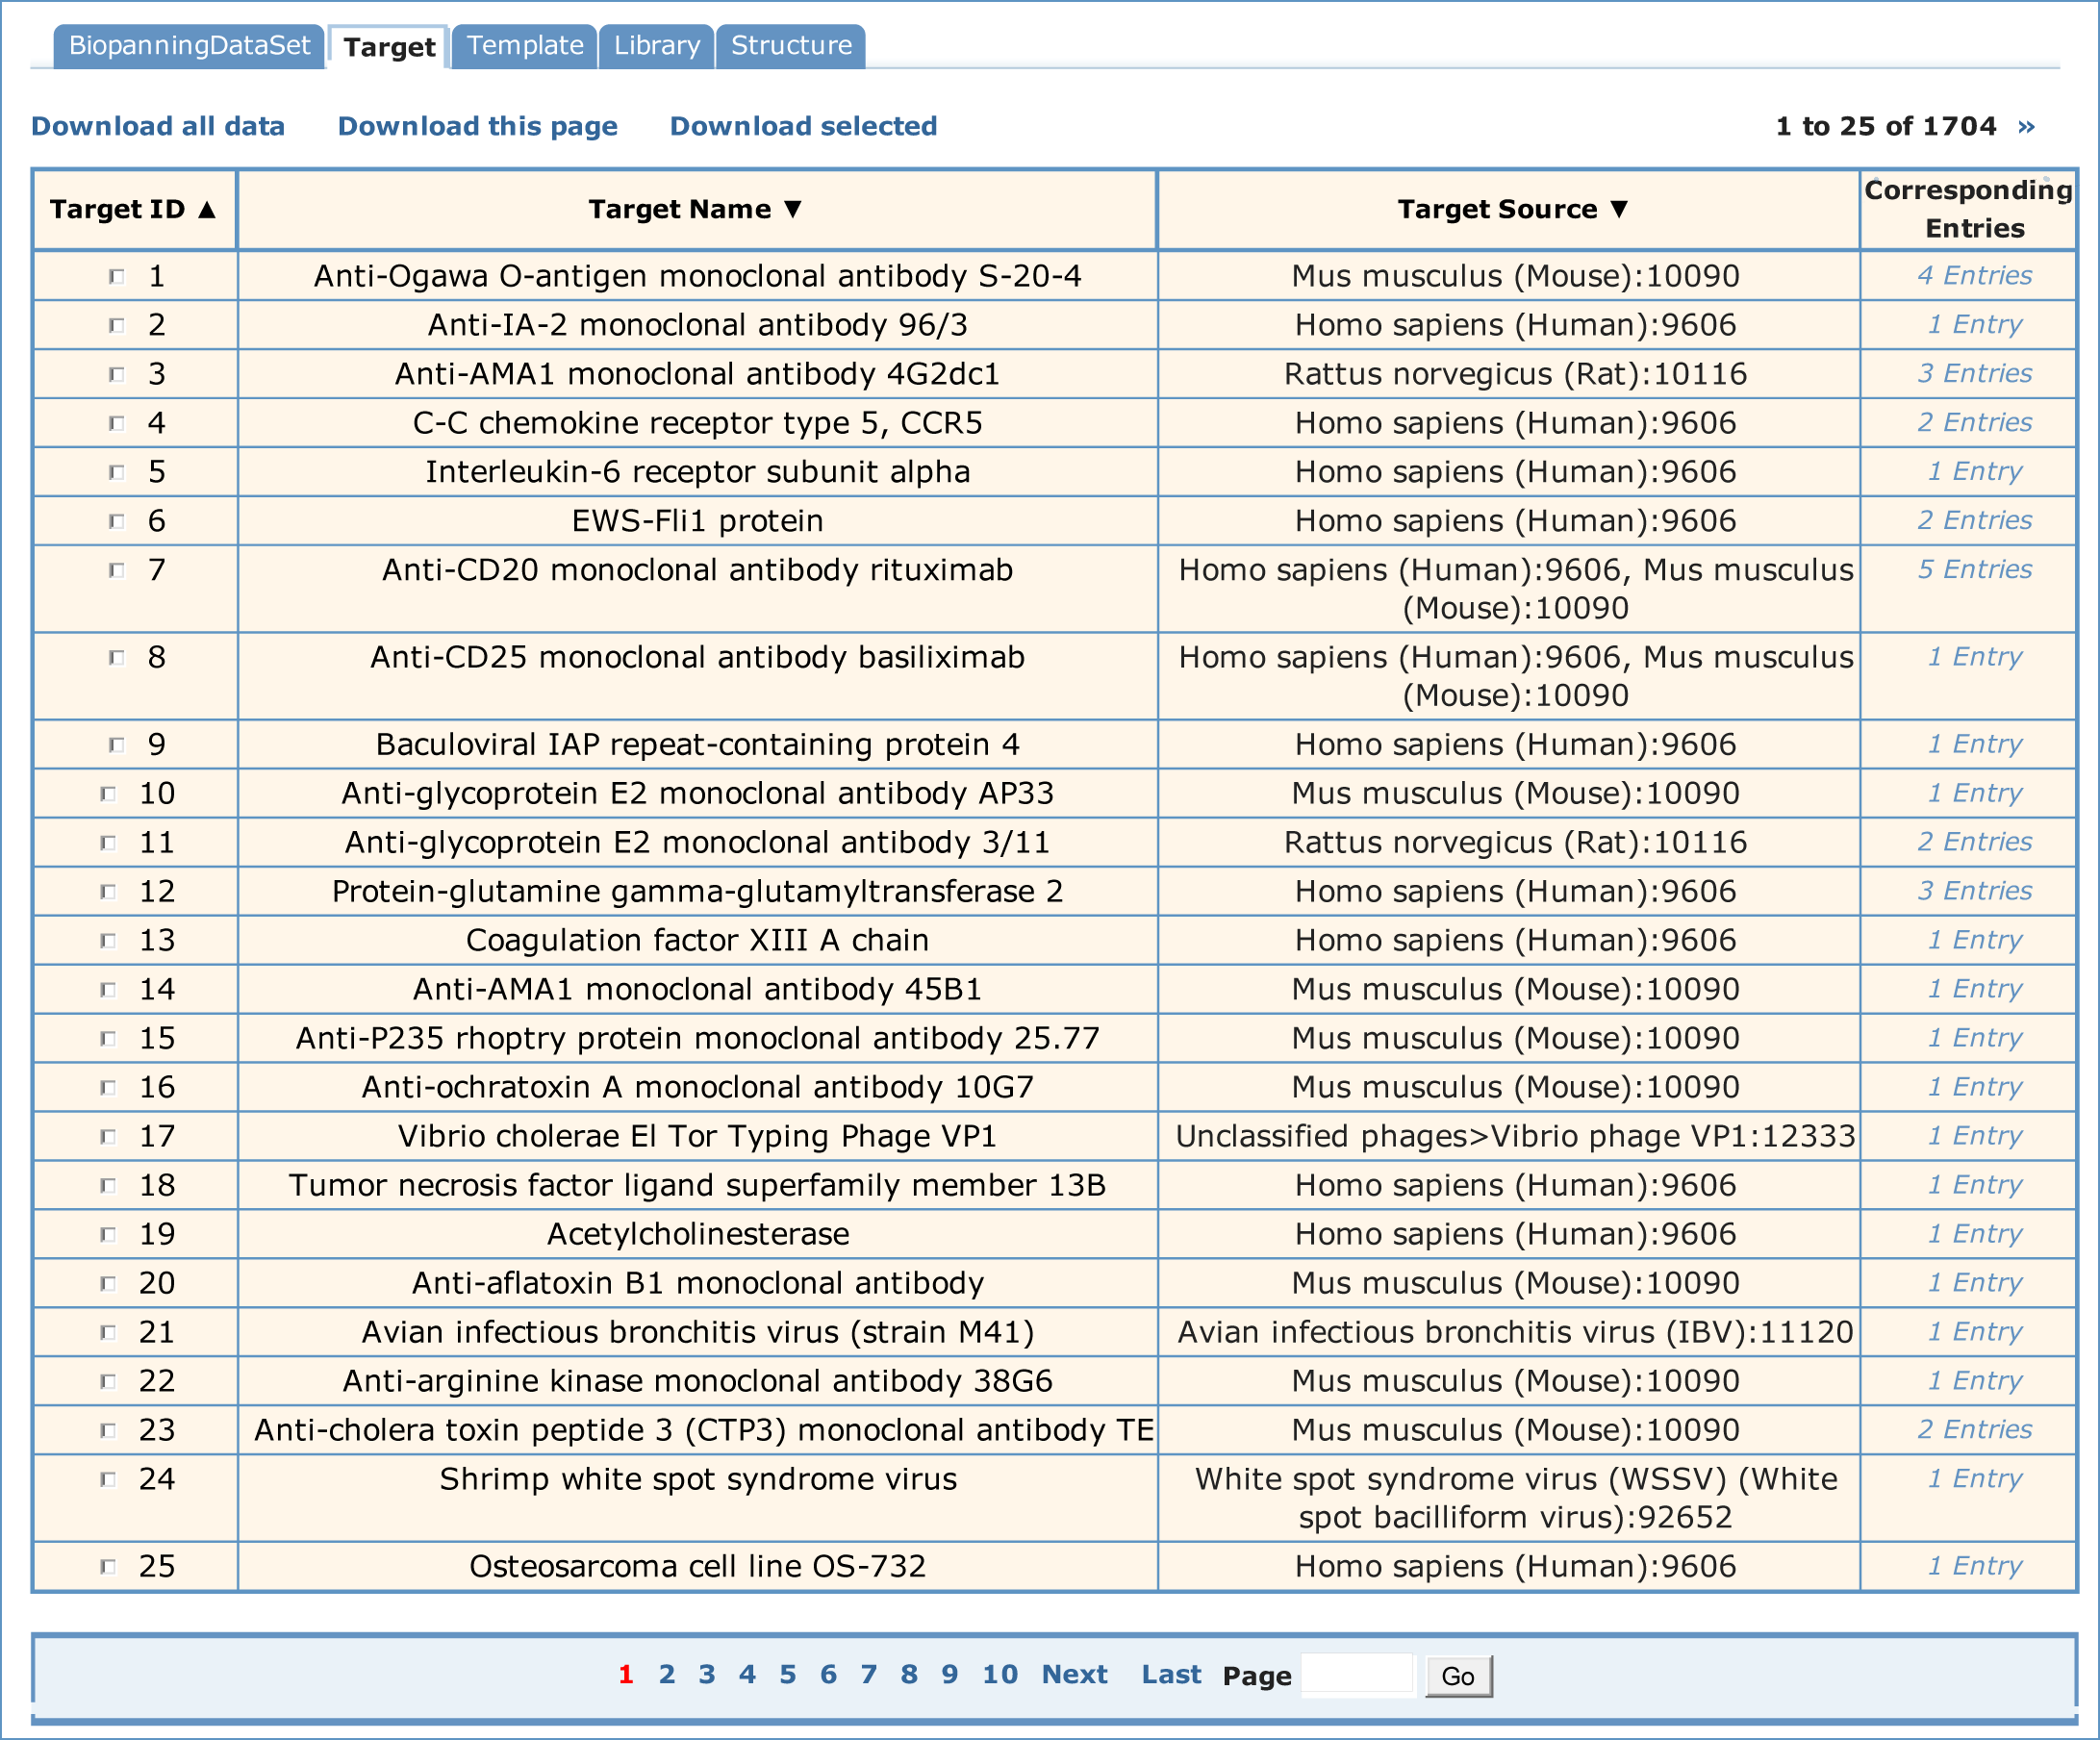
If you wished to see the detailed information about a target, you could choose Target ID or Target Name in the simple table. Below is the detailed information of anti-Ogawa O-antigen monoclonal antibody S-20-4. Users can move from entry to entry by clicking "First", "Prev", "Next" or "Last" options or entering the Entry ID at the bottom of each page.

Name of target. It is quite often that the same target is named differently in different papers. To standardize target name, the recommended name of UniProt is used if available; or the name in the original paper is used.
Unique identification of target.
All targets are grouped into following types: organ and tissue, cell, protein (monoclonal antibody, polyclonal antibody, receptor, others), nucleic acid, inorganic materials and miscellaneous.
Sequence ID of the target in primary sequence databases such as Uniprot and GenBank. This field is hyperlinked to Uniprot or GenBank.
Aliases and corresponding abbreviations of target.
The organism name to which the target belongs. For some targets, such as small compounds and macromolecular materials (e.g. cellulose and polystyrene), this field is null.
The PDB code of target if available. Hyperlinked to the PDB database.
Any specific comments on the target.
If one wished to see the target information, you would select the "Template" table. A paged summary table will be shown first, in which are the fields of Template ID, Template Name, Template Source and Corresponding Entries. The Corresponding Entries field summarizes how many sets of biopanning data which include this template and can be hyperlinked to those biopanning data sets. In addition, users can order all the templates by Template ID, Template Name and Template Source.
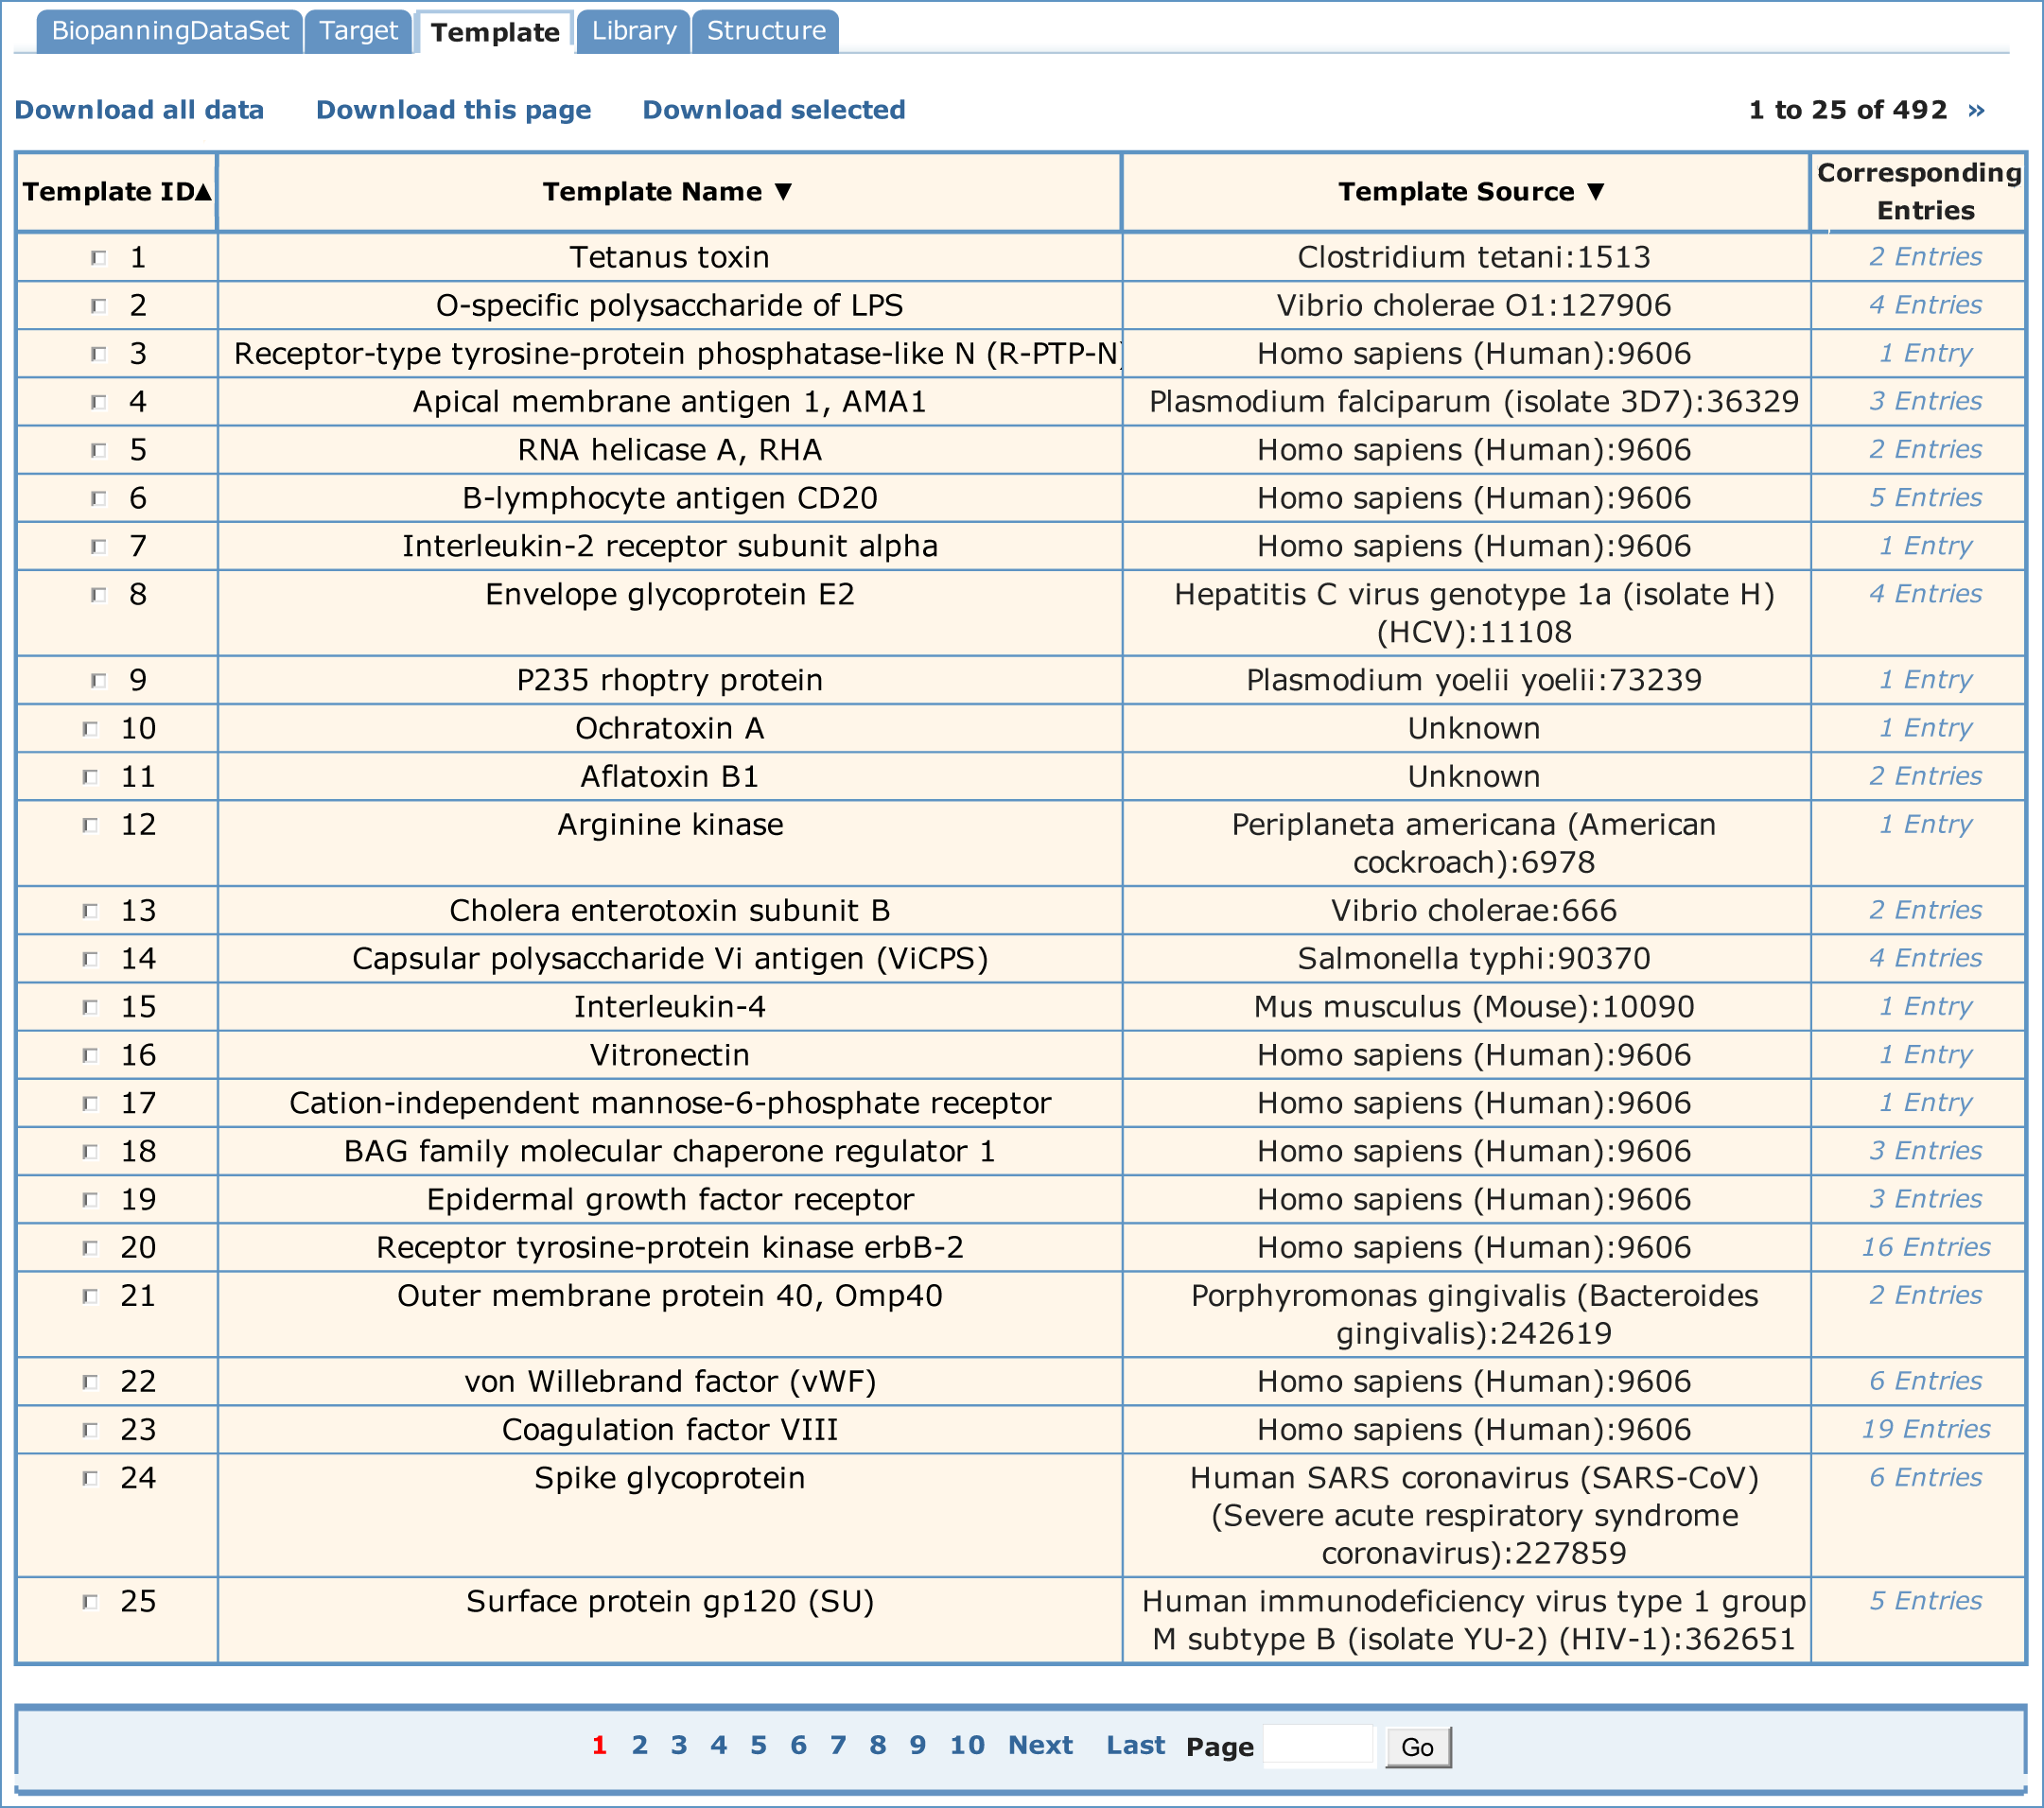
To see the detailed information about a template, you could choose Template ID or Template Name in the simple table. Below is the detailed information of tetanus toxin. Users can move from entry to entry by clicking "First", "Prev", "Next" or "Last" options or entering the Entry ID at the bottom of each page.

Name of template. To standardize template name, the recommended name of UniProt is used if available; or the name in the original paper is used. For most of the targets in the BDB database, their templates are not or even can not be determined.
Unique identification of template.
All targets are grouped into following types: organ and tissue, cell, protein (monoclonal antibody, polyclonal antibody, receptor, others), nucleic acid, inorganic materials and miscellaneous.
Sequence ID of the template in primary sequence databases such as Uniprot and GenBank. This field is hyperlinked to Uniprot or GenBank.
Aliases and corresponding abbreviations of template.
The organism name to which the template belongs. For some targets, such as small compounds and macromolecular materials (e.g. cellulose and polystyrene), this field is null.
The PDB code of template if available. Hyperlinked to the PDB database.
Any specific comments on the template.
To browse library information, you would select the "Library" table. Then a simple table will be shown, in which are the fields of Library ID, Library Name, and Corresponding Entries. The Corresponding Entries field summarizes how many sets of biopanning data which include this library and can be hyperlinked to those biopanning data sets.

If you wish to see the detailed information about a library, you can choose Library ID or Library Name in the simple table. Below is the detailed information of Ph.D.-12 phage display library (X12). Users can move from entry to entry by clicking "First", "Prev", "Next" or "Last" options or entering the Entry ID at the bottom of each page.

Name of Library.
Unique identification of library.
The number of random amino acid in the vector.
The estimated number of unique phage clones in a library.
A measure of the concentration of infectious phage in a library, usually the number of plaque forming units per mL. This number can be used to dilute the phage allowing maximum plaques without plaque superimposition.
Reseachers and/or organisations constructed the library.
Complete random: the random amino acids are continuous from the beginning to end. Semi-random: in the foreign inserts, the random amino acids are interrupted by fixed amino acids.
The making of the codons of the random amino acid.
Linear: the inserted peptides are linear. Circular: the inserted peptides are constrained by two cysteines.
Any specific comments on the library.
To browse comlex structure information, you would select the "Structure" table. Then a simple table will be shown, in which are the fields of Complex ID, Structure Code, and Corresponding Entries. The Corresponding Entries field summarizes how many sets of biopanning data which include this complex structure and can be hyperlinked to those biopanning data sets.

If you wished to see the detailed information about a complex structure, you would choose Structure ID or Structure Code in the simple table to link to corresponding structure. Below is the detailed information of 1G1S. Users can move from entry to entry by clicking "First", "Prev", "Next" or "Last" options or entering the Entry ID at the bottom of each page.

Unique identification of complex structure.
PDB code of the complex structure. The code is hyperlinked to the PDB database. The view icon beside the PDB code is linked to the BDB complex viewer interface.
Chain pairs making interaction interface. If available, this field is hyperlinked to the corresponding page of PDBsum database, where a schematic presentation of the interface is shown.
Interacting residues and segments and their locations on the target. The data is extracted from the PDBsum database if available; or calculated with the CONTACT program of CCP4 package at 4 angstrom cut off. Residues composing the interaction site are usually grouped into the same segment if they are spaced by only one residue in the sequence.
Interacting residues and segments and their locations on the partner (i.e. template or mimotope). The data is extracted from the PDBsum database if available; or calculated with the CONTACT program of CCP4 package at 4 angstrom cut off. Residues composing the interaction site are usually grouped into the same segment if they are spaced by only one residue in the sequence.
Any specific comments on the complex structure.